
Fig. 8
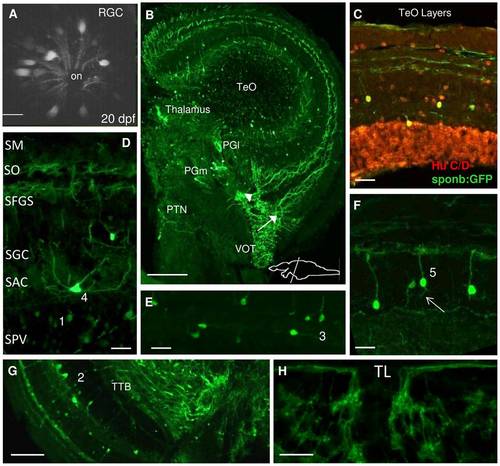
Spon1b expression in areas of the visual system. A. Spon1b expression in retinal ganglion cells (RGC) forming optic nerve (on) in live zebrafish at 20 dpf. Confocal image. B. Coronal section of adult zebrafish fish brain at the level of the optic tectum (TeO) showing spon1b-positive retino-tectal projections of the ventrolateral optic tract (VOT) splitting into two TeO layers: stratum fibrosum et griseum superficiale (SFGS, arrow) and stratum opticum (SO, arrowhead). Spon1b-positive cells in the medial (PGm) and lateral (PGl) preglomerular nuclei, and in the posterior tuberal nucleus (PTN). C. Double immunostaining in TeO demonstrates co-localization of spon1b:GFP (green) and Hu C/D (red) signal, confirming the neuronal nature of spon1b-positive cells. D. Coronal section identifying six TeO layers, with spon1:GFP expression in retinotectal projections in SO and SFGS, cell types 1 (in SPV border) and 4 (in SAC). E. Type 3 TeO cell, with horizontal projections in the SAC layer. F. Type 5 TeO cells with vertical projections in the SGC layer. G. Type 2 TeO cell with vertical projections traversing all TeO layers and forming the tectobulbar tract (TTB). H: Spon1b-positive cells and rami-like neuropil in the torus longitudinalis (TL). Scale bars: A: 10 μm; B: 100 μm; E-F: 15 μm; D,H: 20 μm, G: 50 μm. |
| Gene: | |
|---|---|
| Fish: | |
| Anatomical Terms: | |
| Stage Range: | Days 14-20 to Adult |