
Fig. 3
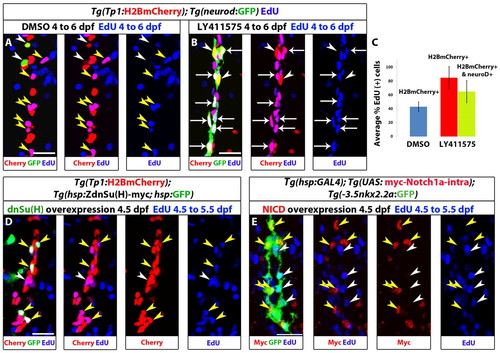
Notch signaling downregulation induces cell cycle progression of NRCs, whereas Notch signaling upregulation triggers their quiescence. (A-C) Larvae were treated with DMSO or 10 μM LY411575 from 4 to 6 dpf (52 hours) in the presence of EdU. (A) DMSO-treated control larva. Yellow arrowheads indicate EdU+ NRCs; white arrowheads indicate two endocrine cells along the IPD (projection of several planes). (B) The LY411575-treated larva showed an increase in the number of endocrine cells. Note that the majority of the new endocrine cells are EdU+ (arrows) and only two endocrine cells are EdU– (arrowheads) (projection of several planes). Upon endocrine differentiation, however, NRCs exit the cell cycle (see supplementary material Fig. S3B,C). (C) Quantification of average percentage of EdU+ cells for A and B. Blue bar: on average, 43% of the NRCs in DMSO controls were EdU+ (140 cells counted in 7 larvae). Red bar: on average, 85% of the NRCs not undergoing endocrine differentiation in LY411575-treated larvae were EdU+ (140 cells counted in 7 larvae) (P<0.001). Green bar: the majority (65%) of new endocrine cells were EdU+ (129 cells counted in 7 larvae). Error bars indicate s.d. (D,E) Larvae were heat shocked at 4.5 dpf to induce mosaic expression of (D) ZdnSu(H)-myc or (E) myc-Notch1a-intra, and incubated in EdU for 24 hours (4.5 to 5.5 dpf). EdU incorporation was scored in cells positive or negative for the transgenes. (D) (ZdnSu(H)-myc)+ cells are identified by GFP expression (supplementary material Fig. S4A). Yellow arrowheads indicate five GFP+ NRCs, all of which are EdU+. Neighboring GFP– NRCs (white arrowheads) incorporate EdU stochastically (projection of several planes). Eighty-one percent of GFP+ NRCs were EdU+ (104 cells counted in 52 larvae), whereas 42% of GFP– NRCs were EDU+ (351 cells counted in nine larvae). (E) Myc staining marks myc-Notch1a-intra overexpressing cells (red) and Tg(Nkx2.2a:GFP) expression marks IPD cells (green). Myc+ IPD cells are EdU– (yellow arrowheads). EdU incorporation is restricted to neighboring Myc- IPD cells (white arrowheads) (projection of several planes). All images are lateral views, anterior towards the top, ventral towards the right. Scale bars: 20 μm. |