
Fig. S1
- ID
- ZDB-FIG-110804-18
- Publication
- Kapsimali et al., 2011 - Fgf signaling controls pharyngeal taste bud formation through miR-200 and Delta-Notch activity
- Other Figures
- All Figure Page
- Back to All Figure Page
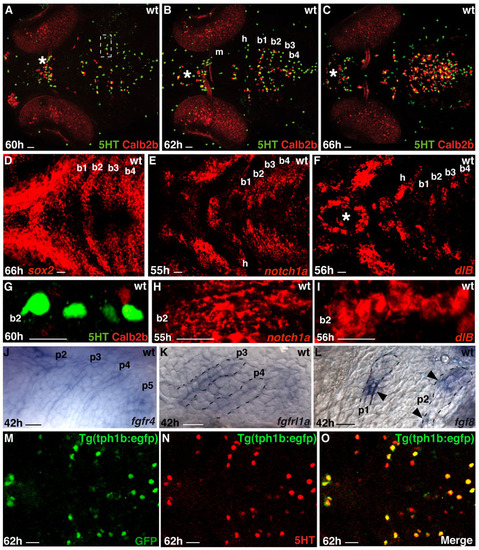
Expression patterns of taste bud and oropharyngeal epithelium markers. Scale bars: 10 μm. (A-C) Ventral views of larval heads showing the progressive increase in taste bud cells labelled with anti-5HT (green) and anti-Calb2b (red). (D-F) Horizontal optical sections (15 μm, 6 μm and 6 μm) through the larval oropharynx showing sox2, notch1a and dlB expression, respectively, during and before 5HT, ascl1a, Calb2b and miR-200 expression. (G-I) Comparison of the first appearing 5HT and Calb2b expression (60 hpf) with notch1a and dlB expression 4-5 hours earlier. These pictures are high magnifications of the branchial arch 2 half shown in A (inset), E,F. (J-L) Fgf receptors and ligands are expressed in the pharyngeal epithelium around the timing of taste bud formation. Whole-mount (J, lateral view) and sectioned (K,L-sagittal) larval oropharyngeal areas labelled with fgfr4 (J), fgfrl1a (K) and fgf8 (L) probes. Broken lines mark the limits of pharyngeal pouches (p1-5). The arrowheads in L indicate the restricted fgf8 expression in the pharyngeal pouches. (M-O) Horizontal optical section (1.5μm) through a tg(tph1b:egfp) transgenic embryo showing co-expression of the transgene (GFP) and 5HT. |