
Fig. 1
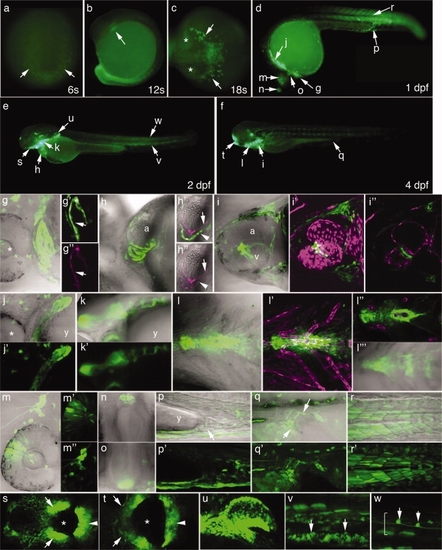
Developmental profile of pSmad1/5/8-mediated transcriptional activity in Tg(bre:egfp)pt510 embryos. In all images, green represents bre-driven EGFP expression. Magenta represents endothelial expression of Tg(fli1ep:dsRedEx)um13 or myocardial expression of Tg(-5.1myl7:nDsRed2)f2, as noted below. g-r, h2, h3, l32: Fluorescence/transmission overlays. a-f: Macro images. a: Six somites. Arrows point to tailbud. b: Twelve somites. Arrow points to myeloid progenitors. c: Eighteen somites. Asterisks denote eyes; arrows point to myeloid cells. d-f: Embryos at 1 (d), 2 (e), and 4 (f) dpf. Lettered arrows denote expression domains highlighted in correspondingly lettered panels below. g-w: 2D projections of confocal Z-series, except h2, h3, i3, and l3, which represent single optical sections extracted from the corresponding Z-series. Magnification, 400×. g-g3: Heart at 1 dpf. Asterisk denotes eye. g2 and g′′ are matched substacks showing EGFP/fli1ep:dsRedEx (overlay) and fli1ep:dsRedEx expression, respectively. Arrows denote endocardium. h-h3: Heart at 2 dpf. h2 and h′′ are matched optical sections of EGFP/ fli1ep:dsRedEx/-5.1myl7:nDsRed2 (overlay) and fli1ep:dsRedEx/-5.1myl7:nDsRed2. Arrows denote endocardium; arrowheads denote myocardium. i-i3: Heart at 4 dpf. i2 and i′′ show overlays of EGFP with fli1ep:dsRedEx, 2D projection and single optical section, respectively. j-j2: Pharyngeal arches, 1 dpf. Asterisk denotes eye. k,k2: Pharyngeal arches, 2 dpf. l-l32: Pharyngeal arches, 4 dpf. l2, l3: Overlays of EGFP with fli1ep:dsRedEx, 2D projection, and single optical section, respectively. l32: Substack of image shown in l. m-m3: Dorsal retina (m2) and trigeminal ganglion (m′′), 1 dpf. n: Pineal gland, 1 dpf. o: Hypothalamus, 1 dpf. p, p2: Ventral mesenchyme and cloaca (arrow), 2 dpf. q, q2: Cloaca, 4 dpf. Arrows delineate cloacal opening. r, r2: Somites, 1 dpf. s: Stomodeum, 2 dpf. Asterisk, presumptive mouth opening; arrows, maxillary process; arrowhead, mandibular process. t: Stomodeum, 4 dpf. Asterisk, open mouth; arrows, maxillary process; arrowhead, mandibular process. u: Pectoral fin bud, 2 dpf. v: Mesenchymal cells of the median finfold (arrows), 2 dpf. w: Spinal cord neurons (arrows), 2 dpf. Spinal cord is bracketed. a: Dorsoposterior view, posterior down. b, d-g, j, k, m, p-r, u-w: Lateral view, anterior left, dorsal up. c: Dorsal view, anterior left. h, i, l: Ventral view, anterior left, left up. n: Dorsal view, left to the right. o: Frontal view, left to the right. s, t: Frontal view, left up. a, atrium; v, ventricle; y, yolk. |