
Fig. S6
- ID
- ZDB-FIG-101116-5
- Publication
- Padmanabhan et al., 2009 - Cardiac and vascular functions of the zebrafish orthologues of the type I neurofibromatosis gene NFI
- Other Figures
- All Figure Page
- Back to All Figure Page
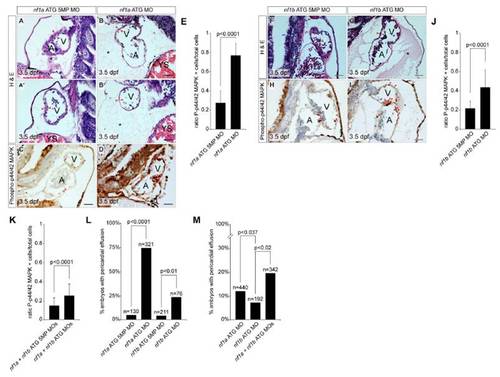
MO knockdown of nf1a or nf1b results in a thinning of the ventricular myocardium and increased phospho-Erk staining in cardiac tissue. (A, A′, B, B′, F, and G) Transverse histological sections through the heart of 3.5-dpf zebrafish embryos reveals a thinning of the ventricular myocardium (red arrows) of zebrafish treated with nf1a or nf1b ATG MOs when compared with the corresponding controls (A, atrium; V, ventricle; YS, yolk sac). Notably, a large pericardial effusion can be appreciated in nf1a and nf1b morphants (*). (C,D,H, and I) Immunohistochemichal analysis of transverse sections through 3.5-dpf zebrafish hearts reveals an up-regulation of phospho-p44/42 MAPK (phospho-Erk) in nf1a or nf1b morphants when compared with the appropriate 5MP controls. The ratio of phospho-Erk-positive cardiac cells to the total number of cardiac cells was quantified over multiple sections for nf1a MO(2 ng), nf1bMO(2 ng), and nf1a+nf1b MO (2 ng) groups (mean ratio phospho-p44/42 MAPK positive cardiac cells/total cardiac cells ± SD) (E, J, and K). (L) Quantification of percentage of embryos displaying a pericardial effusion phenotype at 3.5 dpf following injection of ≈2 ng of nf1a ATG 5MP MO, nf1a ATG MO, nf1b ATG 5MP MO, or nf1b ATG MO. Some 75% of nf1a ATG morphants displayed pericardial effusions as compared with5%of nf1a ATG 5-mispair (5MP) morphant controls (P<0.0001). Some 24% of nf1b ATG morphants displayed pericardial effusions as compared with 4% of nf1b ATG 5MP morphant controls (P < 0.01). (M) Quantification of percentage of embryos displaying a pericardial effusion phenotype at 3.5 dpf following injection of nf1a ATG MO, nf1b ATG MO, or nf1a + nf1b ATG MO. A suboptimal dose (1 ng) of nf1a ATG MO resulted in a 12% incidence of pericardial effusion, whereas a suboptimal dose (1 ng) of nf1b ATG MO resulted in a 7% incidence of pericardial effusion. Injection of 1 ng of a combination of nf1a + nf1b ATG MO, however, resulted in a 20% incidence of pericardial effusion. (Scale bars: 25 μm.) |