
Fig. 5
- ID
- ZDB-FIG-101104-53
- Publication
- Hui et al., 2010 - Cellular response after crush injury in adult zebrafish spinal cord
- Other Figures
- All Figure Page
- Back to All Figure Page
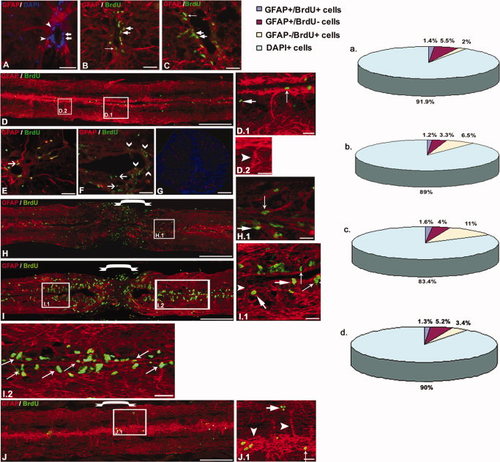
Immunohistochemical staining of GFAP and BrdU in zebrafish uninjured (A,B, D,E, D.1, and D.2) and injured (C, F, H-J, H.1, I.1, and J.1) spinal cord. A, B: Uninjured cord section showing that a percentage of DAPI+ cells are GFAP+ radial glia (arrowhead) and the presence of BrdU+ cells (thick arrow) around the central canal; some colocalize with GFAP (→). C: 7dpi cord section shows an greater number of BrdU+ cells around the central canal than normal; a few colocalized with GFAP (→). D: Uninjured cord showing high GFAP expression and the presence of few BrdU+ cells. Same cord at a higher magnification showing different radial glial population, GFAP+/BrdU+ (↑) and GFAP-/BrdU+ (thick arrow) cells (D.1) and GFAP+/BrdU- cells (▼) (D.2), respectively. E: Ependyma of uninjured cord showing many more slow-dividing cells (→), some of which are radial glia and a few fast-dividing cell. F: 7dpi cord representing many BrdU+, fast-dividing cells that are GFAP- (∨) and fewer slow-dividing cells (→) around ependyma. G: Control section stained without GFAP primary antibody. H: 3dpi cord, showing proliferating BrdU+ cells; only some are GFAP+. Also shown is a loss of GFAP expression at the injury epicenter ([down-bracket]) and at an immediately adjacent part of the cord. H.1: Same cord as in H at higher magnification showing both GFAP+/BrdU+ (↑) and GFAP-/BrdU+ (thick arrow) cells. I: 7dpi cord showing high proliferation, a low level of GFAP expression at the injury epicenter, and little higher level of GFAP expression at the immediate adjacent area. I.1: Same cord at higher magnification shows presence of GFAP+/BrdU+ (↑), GFAP-/BrdU+ (thick arrow) and GFAP+/ BrdU- (▼) cell populations. I.2: Same cord shows the presence of many GFAP+/BrdU+ (↑) cells. J: Fifteen-day regenerated cord shows a reduced BrdU incorporation but a high level of GFAP expression in both the uninjured part and the injury epicenter. J.1: Same section at higher magnification also represents three populations. a-d: The pie chart represents the percentage of three cell populations and DAPI+ cells in adult uninjured (a), 3dpi (b), 7dpi (c), and 15dpi (d) cord, respectively. Scale bar = 250 μm (D and H–J), 20 μm (A-C, E-G, D.1-J.1). |