
Fig. 4
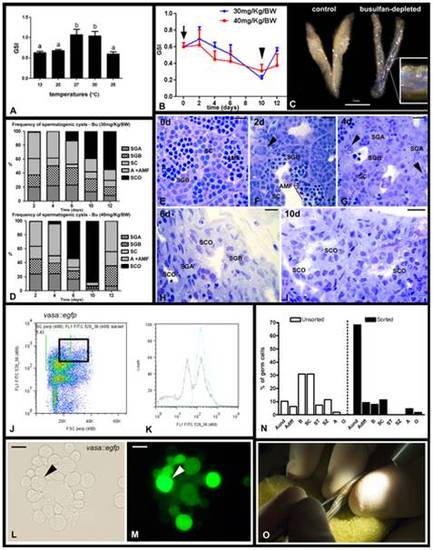
Depletion of endogenous spermatogenesis in male recipients for SSC transplantation. A. Effects of different temperatures on zebrafish GSI (gonadosomatic index). Bars represent mean ± SE (n = 15, 20°C), (n = 12, 27°C), (n = 7, 30°C), and (n = 12, 35°C). Different letters indicate significant differences (p<0.05) among groups. B. Effects of two single doses of busulfan (30 or 40 mg/Kg) on zebrafish GSI. The arrow indicates the day of injection (day 0), the arrowhead shows that the lowest GSI is observed 10 days after injection. Dots represent mean±SE (n = 6). C. Testes from control (27°C, left) and busulfan-depleted animals. Inset shows a high magnification of the depleted testis after in vivo injection via the urogenital pore of a solution containing trypan blue. D. Frequency of spermatogenic cysts after a single dose of 30 or 40 mg/Kg busulfan. Type A spermatogonia (SGA), type B spermatogonia (SGB), spermatocytes (SC), apoptosis and abnormal metaphase I figures (A+AMF), Sertoli cell only (SCO). Bars represent means expressed as percentage. E–I. Histological sections of testes collected at 0 (E), 2 (F), 4 (G), 6 (H), and 10 (I) days after a single injection of 40 mg/Kg busulfan at 35°C. Note that busulfan induced spermatogonial apoptosis (arrowheads) after 4 days of injection. Scale bars = 10 μm. J. Testicular cell suspensions were obtained from vasa::egfp testes and subjected to FACS. Dot plot shows the total testicular suspension from which a population of large cells (forward scatter, FSC; abscissa), showing an intense fluorescence (FL1 FITC; ordinate) was sorted (black square). K. Histogram shows an enrichment of the sorted cells after FACS. Blue line (sorted cells), black line (total testicular cell suspension). FL1 FITC (x axis) means intensity of fluorescence, and counts (y axis), the number of events. L,M. Fraction of sorted cells under normal light (L) and under fluorescence (M). Arrow indicates a large cell carrying high fluorescence. Scale bars = 10 μm. N. Histogram showing the percentage of germ cells in the unsorted and sorted fractions. Despite of the contamination with other germ cell types (cell clumping before FACS), there is an enrichment of type A undifferentiated spermatogonia (Aund*/Aund) population, which might contain SSC candidates. Undifferentiated type A spermatogonia (Aund* and Aund), differentiating type A spermatogonia (Adiff), type B spermatogonia, spermatocytes (SC), spermatids (ST), spermatozoa (SZ), apoptosis (A) and others (O). Bars represent means expressed as percentage. O. Germ cell transplantation into zebrafish genital pore using a glass capillary needle. |