
FIGURE
Fig. 1
- ID
- ZDB-FIG-100513-13
- Publication
- Coffin et al., 2010 - Chemical Screening for Hair Cell Loss and Protection in the Zebrafish Lateral Line
- Other Figures
- All Figure Page
- Back to All Figure Page
Fig. 1
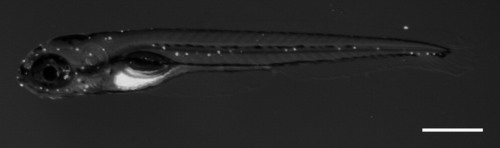
Fluorescent micrograph of a 5 days postfertilization zebrafish labeled with the mitochondrial potentiometric dye DASPEI. Each white dot is a neuromast arrayed along the head and body of the animal. Scale bar = 500 μm. |
Expression Data
Expression Detail
Antibody Labeling
Phenotype Data
Phenotype Detail
Acknowledgments
This image is the copyrighted work of the attributed author or publisher, and
ZFIN has permission only to display this image to its users.
Additional permissions should be obtained from the applicable author or publisher of the image.
Full text @ Zebrafish