|
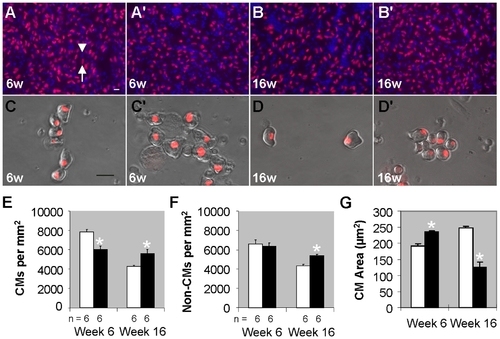
Myocyte hypertrophy contributes to early stages of cardiac remodeling in tr265/tr265. (A–B′) Images of cardiomyocytes (red+ blue+; arrow) and non-cardiomyocytes (blue+ only; arrowhead) in week-6 and -16 (A, B) sibling and (A′,B′) tr265/tr265 ventricle sections from fish outcrossed to Tg(cmlc2:nuDsRed) fish, whose terminally-differentiated cardiomyocyte nuclei are fluorescent red; blue is Hoechst-labeling of nuclei; bar = 10 μm. (C–D′) Dissociated ventricular cardiomyocytes cultured and imaged to reveal cell size and shape from week-6 and-16 (C,D) sibling and (C′,D′) tr265/tr265 fish; bar = 20 μm. (E) Cardiomyocyte and (F) non-cardiomyocyte density (cells/mm2) from fish represented in A–B′. (G) Surface area (in μm2) of cultured cardiomyocytes, like the ones in C–D′. (E–G) mean±SEM; * = P<0.05. n = number of fish examined.
|