
Fig. 4
- ID
- ZDB-FIG-090519-18
- Publication
- Kitambi et al., 2009 - Small molecule screen for compounds that affect vascular development in the zebrafish retina
- Other Figures
- All Figure Page
- Back to All Figure Page
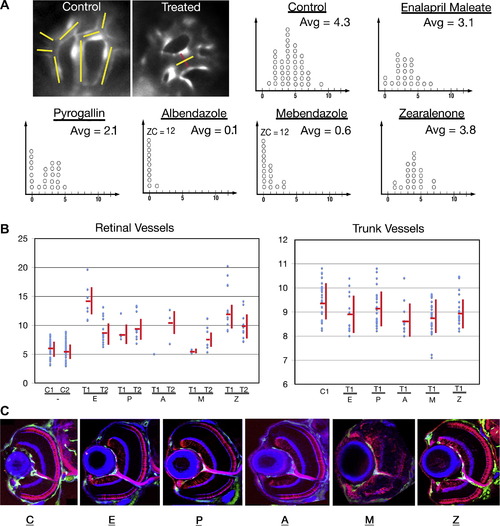
The number and thickness of retinal and trunk vessels following treatment with different chemicals. (A) Top left image panels illustrate the method of counting and measuring vessels. In the control image panel, yellow lines indicate the vessel segments. The image of a treated retina shows an example of vessel segment thickness measurement (the line in red indicates thickness). Graphs in panel A show the number of ocular vessel segments in control and chemically treated animals. x-axis provides the number of vessel segments per eye; each circle represents a single retina. Retinae with absent or collapsed vessels only are given the value of 0. The average number of blood vessel segments (Avg) per eye is provided in the upper left corner of each graph. In cases where the number of retinae in the zero category exceeds 10, its size is provided numerically as ZC (zero category). In this experiment, for each compound, we chose the highest concentration that is known to produce retinal blood vessel changes but does not affect trunk vasculature (Mebendazole) or retinal lamination (enalapril maleate, pyrogallin, albendazole, and zearalenone). (B) Vessel thickness measurements in control and chemically treated embryos. Untreated controls are indicated as C1 and C2, while small molecule tests as T1 and T2. T1 represents the highest concentration producing eye-specific vasculature phenotype that does not cause a disorganization of the retina and T2 represents the lowest concentration sufficient to produce an eye vasculature phenotype. In the case of mebendazole, neuronal organization is affected at all concentrations tested, and so we provide data for the highest concentration that affects the eye but not the trunk vasculature. Statistical significance was evaluated for T1 and T2 concentrations of each compound: Enalapril maleate: p < 0.001 for T1, p < 0.001 for T2; Pyrogallin: p value not significant for T1, p < 0.001 for T2; albendazole: p not significant for both T1 and T2, most likely due to small sample size, Mebendazole: p not significant for T1, p < 0.05 for T2; Zearalenone: p < 0001 for T1, p < 0.001 for T2. Trunk vessel thickness is provided for the T1 treatment only. The trunk vessel thickness measurements also yielded statistically significant values for albendazole p < 0.01 and mebendazole p < 0.001. (C) Confocal images of transverse sections through control and chemically treated retinae, showing the organization of neuronal layers. Retinal ganglion cells including the optic nerve, and photoreceptors are visualized with Zn-8 and Zpr-1 antibodies, respectively (both in red) and intraocular vessels are marked by GFP expression (green). To visualize plexiform layers, sections were counterstained with fluorophore-conjugated phalloidin (blue). The concentrations of chemicals used for experiments shown in these panels are indicated in Table 1 in italics. |
Reprinted from Mechanisms of Development, 126(5-6), Kitambi, S.S., McCulloch, K.J., Peterson, R.T., and Malicki, J.J., Small molecule screen for compounds that affect vascular development in the zebrafish retina, 464-477, Copyright (2009) with permission from Elsevier. Full text @ Mech. Dev.