
Fig. S1
- ID
- ZDB-FIG-090408-67
- Publication
- Borodovsky et al., 2009 - Neural protein Olig2 acts upstream of the transcriptional regulator sim1 to specify diencephalic dopaminergic neurons
- Other Figures
- All Figure Page
- Back to All Figure Page
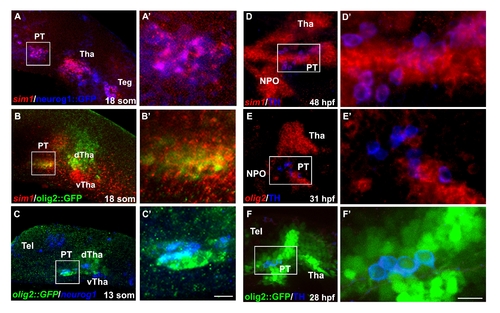
Co-expression of Sim1 and Olig2 with Neurog1 and DA neurons in the posterior tuberculum. (A,B) Spatial expression analyses of sim1 in transgenic reporter lines expressing GFP, which is driven by the respective olig2(olig2::GFP) or neurog1 (neurog1::GFP) promoters. The expression of sim1 mRNA was visualized using fluorescent in-situ hybridization (red) followed by detection of either olig2- or neurog1-expressing cells with anti-GFP antibody. For the purpose of clarity, the expression of neurog1::GFP is visualized in pseudo color (blue). (C) Whole mount fluorescent in-situ hybridiztion of neurog1 (blue, pseudo color) followed by immunofluorescent staining of GFP which marks olig2-expressing cells. (D,E) Expression of sim1 and olig2 (red) followed by anti-TH immunohistochemistry (blue). (F) Transgenic embryos expressing GFP (green) under the control of the olig2 promoter (olig2::gfp) stained with anti-TH antibody (blue, pseudo color). (A′-F′) High magnification images of the posterior tuberculum area. The area of magnification is marked by a white square. dTha, dorsal thalamus; hpf, hours post fertilization; NPO; neurosecretory preoptic area PT, posterior tuberculum; som, somites; Teg, tegmentum; Tel, telencephalon Tha, thalamus; vTha, ventral thalamus. All images presented in lateral view, anterior to the left. Scale bars: (A′-C′) 18 μm; (D′-F′) 11.25 μm. |