
Fig. 5
- ID
- ZDB-FIG-080731-14
- Publication
- Parichy et al., 2000 - Mutational analysis of endothelin receptor b1 (rose) during neural crest and pigment pattern development in the zebrafish Danio rerio
- Other Figures
- All Figure Page
- Back to All Figure Page
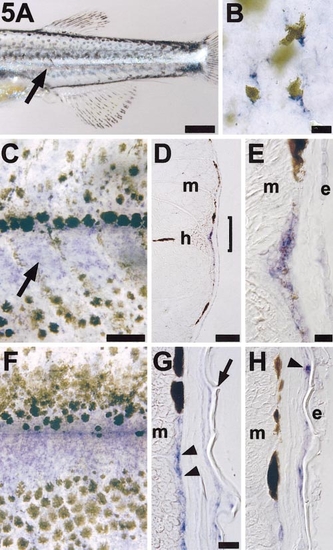
ednrb1 is reexpressed during pigment pattern metamorphosis. (A) A wild-type metamorphosing larva exhibits a bright stripe of iridophores (arrow) immediately ventral to the horizontal myoseptum and between the first developing dorsal and ventral melanocyte stripes. Shown is the posterior trunk of an 18-day larva. (B) Lightly melanized melanocytes express ednrb1 during pigment pattern metamorphosis. Shown are ednrb1+ (blue) melanocytes in flat-mounted skin from a 20 day larva. An additional dark melanocyte can be seen deeper within the larva and out of the plane of focus. (C) ednrb1 is strongly expressed by cells coincident with the developing first iridophore stripe (arrow) immediately ventral to the horizontal myoseptum. Shown is a 21-day larva. (D) A 12-μm cryosection through the trunk of a larva at the stage in (A). Blue ednrb1+ cells can be seen superficial to the myotome (m) and beneath the epidermis near the horizontal myoseptum (h). (E) Higher magnification view of the bracketed region in (D), showing ednrb1+ cells between the myotome (m) and epidermis (e). Spatial resolution among these cells does not allow distinguishing whether faint melanin deposition is associated with ednrb1+ cells or intermingled cells that may not express ednrb1. (F) During later stages of pigment pattern metamorphosis (here, 28 days), ednrb1 expression is maintained between melanocyte stripes and also is evident at lower levels within melanocyte stripes. (G) Cryosection of a similarly staged larva reveals ednrb1+ cells (arrowheads) in the same plane as melanocytes that contribute to dark horizontal stripes. Arrow, dermal scale. (H) Unmelanized ednrb1+ cells (arrowhead) also are evident superficial to stripe melanocytes, associated with the inner surface of scales. Scale bars: (A) 400 μm; (B) 10 μm; (C,F) 100 μm; (D) 100 μm; (E) 10 μm; (G,H) 20 μm. |
Reprinted from Developmental Biology, 227(2), Parichy, D.M., Mellgren, E.M., Rawls, J.F., Lopes, S.S., Kelsh, R.N., and Johnson, S.L., Mutational analysis of endothelin receptor b1 (rose) during neural crest and pigment pattern development in the zebrafish Danio rerio, 294-306, Copyright (2000) with permission from Elsevier. Full text @ Dev. Biol.