
FIGURE
Fig. 3
- ID
- ZDB-FIG-080625-8
- Publication
- Balciunas et al., 2004 - Enhancer trapping in zebrafish using the Sleeping Beauty transposon
- Other Figures
- All Figure Page
- Back to All Figure Page
Fig. 3
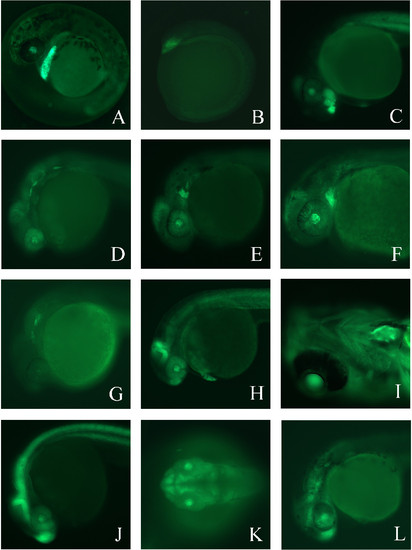
Enhancer trap lines exhibit a variety of unique GFP expression patterns. (A). Lateral view of GFP expression in Enhancer Trap line 1 (ET1) at 38 hours post fertilization (hpf). (B) ET3 at 5–6 somite stage. (C) ET3 at 36 hpf. (D) ET4 at 26 hpf. (E) ET5 at 30 hpf. (F) ET5 at 48 hpf. (G) ET6 at 26 hpf. (H) ET7 at 32 hpf. (I) Ventral view of ET7 at 5 dpf. (J) Lateral view of ET8 at 26 hpf. (K) Dorsal view of ET9 at 28 hpf. (L) Lateral view of ET9 at 30 hpf. In all panels, anterior is to the left. See text for details. |
Expression Data
| Gene: | |
|---|---|
| Fish: | |
| Anatomical Terms: | |
| Stage Range: | 5-9 somites to Day 5 |
Expression Detail
Antibody Labeling
Phenotype Data
Phenotype Detail
Acknowledgments
This image is the copyrighted work of the attributed author or publisher, and
ZFIN has permission only to display this image to its users.
Additional permissions should be obtained from the applicable author or publisher of the image.
Full text @ BMC Genomics