
Fig. 5
- ID
- ZDB-FIG-080514-38
- Publication
- Schilling et al., 2001 - Plasticity in zebrafish hox expression in the hindbrain and cranial neural crest
- Other Figures
- All Figure Page
- Back to All Figure Page
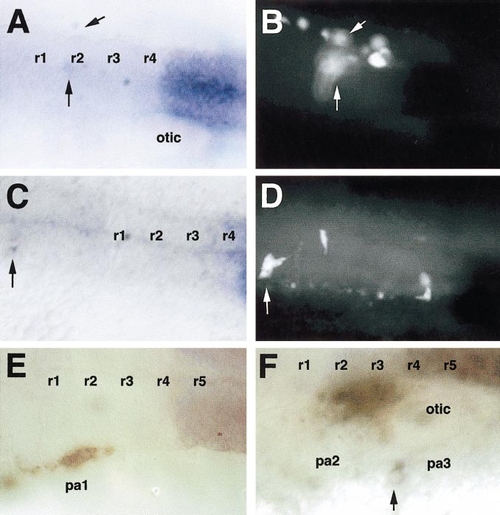
Colocalization of hoxb3 expression and lineage tracer in transplanted neural crest cells. (A, C) Dorsal views of embryos at 20 h colabeled for hoxb3 mRNA by in situ hybridization (blue). (B, D) Corresponding locations of cells labeled with the biotinylated lineage tracer. (E) Dorsal view of a cluster of neural crest cells transposed from the r5/6 level to the r2/3 level and migrating in the first pharyngeal arch (pa1) that were all hoxb3 negative, as determined by the initial in situ hybridization. (F) Left side view of neural crest cells transplanted from the r2/3 level to the r5/6 level and migrating in the third pharyngeal arch (pa3), one of which has become strongly hoxb3 positive (arrow). Rhombomeres are numbered. |
Reprinted from Developmental Biology, 229, Schilling, T.F., Prince, V., and Ingham, P.W., Plasticity in zebrafish hox expression in the hindbrain and cranial neural crest, 201-216, Copyright (2001) with permission from Elsevier. Full text @ Dev. Biol.