
FIGURE
Fig. 3
- ID
- ZDB-FIG-070911-76
- Publication
- Jain et al., 2007 - Bone growth in zebrafish fins occurs via multiple pulses of cell proliferation
- Other Figures
- All Figure Page
- Back to All Figure Page
Fig. 3
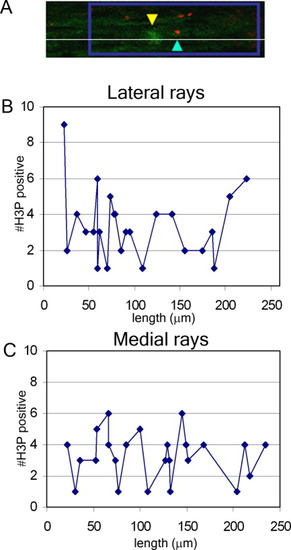
The number of mitotic cells during segment growth appears pulsatile. A: Confocal image of a single section with ZNS5+ cells in green and H3P+ cells in red. The yellow arrowhead indicates the joint; the blue arrowhead indicates a single H3P+ cell in this section (and in this fin ray). The boxed region represents an area 250 μm from the end of the fin. B: H3P + cells in the longest fin ray in the ventral lobe. C: H3P+ cells from the shortest fin ray in the fin. Each data point in B and C represents a single fin ray. N = 25 rays. |
Expression Data
Expression Detail
Antibody Labeling
Phenotype Data
Phenotype Detail
Acknowledgments
This image is the copyrighted work of the attributed author or publisher, and
ZFIN has permission only to display this image to its users.
Additional permissions should be obtained from the applicable author or publisher of the image.
Full text @ Dev. Dyn.