
Fig. 3
- ID
- ZDB-FIG-070822-53
- Publication
- Nakaya et al., 2007 - Expression patterns of alternative transcripts of the zebrafish olfactomedin 1 genes
- Other Figures
- All Figure Page
- Back to All Figure Page
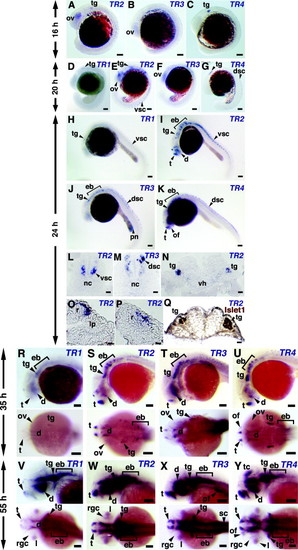
Expression patterns of TR1-4 in developing zebrafish embryos. Antisense RNA probes for whole-mount in situ hybridization were specific for each group and prepared as described in Section 2. (A–C) 16 hpf embryos. (D–G) 20 hpf embryos. (H–P) 24 hpf embryos. L, M, and N show 10 µm frozen sections at the trunk level (L and M) and at the level of hindbrain (N). TR2 and TR3 mRNAs are expressed in the different part of neural tube (L and M). TR2 expression was also observed in trigeminal ganglia (N). O and P show 10 µm frozen sections at the eye level. The strong TR2 signal was detected in dorsal (O) and posterior (P) retina. (Q) 24 hpf embryos first hybridized to TR2 probe and then stained with Islet1 antibodies. Frozen section at the hindbrain level is shown. Trigeminal ganglia (tg) express both TR2 (N) and islet1 (Q). (R–U) 35 hpf embryos. TR1 showed weak signal while all other transcripts are strongly expressed in telencephalon, ventral diencephalons and dorsolateral and epibranchial placodes/ganglia. TR3 has a stronger expression at the preoptic commissure than other transcripts and TR4 is expressed in the olfactory placode. (V–Y) 55 hpf embryos. All transcripts strongly expressed in telencephalon, diencephalons and dorsolateral and epibranchial placodes/ganglia. TR4 has specific expressions in the optic tectum (arrowhead). Abbreviations: d, diencephalon; dsc, dorsal spinal cord; eb, epibranchial placode/ganglia; l, lens; lp, lens placode; nc, notochord; of, olfactory placode; ov, optic vesicle; pn, pronephros; r, retina; rgc, retinal ganglion cells; sc, spinal cord; t, telencephalon; tc, tectum; tg, trigeminal placode/ganglia; vh, ventral hypothalamus; vsc, ventral spinal cord. (A–C) Scale bar, 0.1 mm. (D and E) Scale bar, 0.01 mm. (F and G) Scale bar, 0.1 mm. |
| Genes: | |
|---|---|
| Fish: | |
| Anatomical Terms: | |
| Stage Range: | 14-19 somites to Long-pec |
Reprinted from Gene expression patterns : GEP, 7(7), Nakaya, N., and Tomarev, S., Expression patterns of alternative transcripts of the zebrafish olfactomedin 1 genes, 723-729, Copyright (2007) with permission from Elsevier. Full text @ Gene Expr. Patterns