
Fig. 2
- ID
- ZDB-FIG-070810-4
- Publication
- Zhang et al., 2007 - SCL-GFP transgenic zebrafish: In vivo imaging of blood and endothelial development and identification of the initial site of definitive hematopoiesis
- Other Figures
- All Figure Page
- Back to All Figure Page
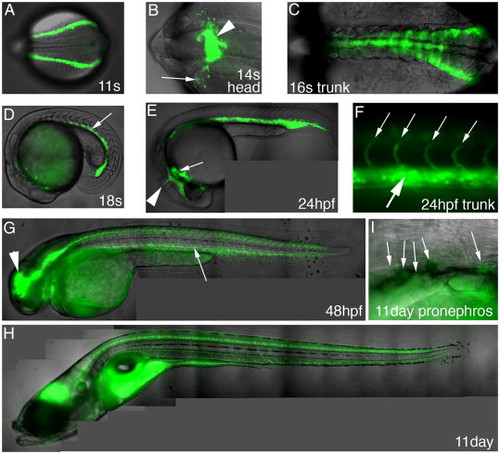
Expression of GFP in the scl-PAC-GFP line completely recapitulates that of endogenous scl (see also Supplementary Fig. 2, online) The figures are composites of DIC and fluorescence images. Except where stated otherwise, all figures are lateral views with anterior to the left. (A) 11 Somites (14.5 hpf), dorsal view of trunk, anterior to left. GFP is expressed in the blood and endothelial precursors in the posterior lateral plate mesoderm (PLM). (B) 14 Somites (16 hpf), dorsal view of head, anterior to left. GFP is expressed in primitive macrophages (arrow) migrating out onto the yolk cell, and the precursors of the head vasculature, including the endocardium (arrowhead). (C) 16 Somites (17 hpf), dorsal view of trunk, anterior to left. GFP expression converges, under the somites, towards the midline. (D) 18 Somites (18 hpf). The GFP-expressing cells in the trunk have formed the intermediate cell mass (ICM, arrow) ventral to the notochord. (E) 24 hpf. As well as the ICM, GFP is expressed in the developing vasculature including the mid cerebellar vessel (arrowhead) and the endocardium and aortic arches. (F) 24 hpf, higher magnification of the trunk. GFP is expressed in the differentiating erythroid cells in the ICM (large arrow) and the endothelium of the segmental vessels (small arrows) that sprout from the dorsal aorta. (G) 48 hpf. GFP is expressed in the CNS, with particularly strong expression in the midbrain (arrowhead) and part of the diencephalon, and in interneurons in the ventral hindbrain and spinal cord. Expression is also visible in the ICM after the primitive erythroid cells have entered circulation (arrow). The fluorescence in the region of the yolk cell results from the flow of blood returning to the heart over the anterior surface of the yolk, along with autofluorescence of the yolk granules. (H) 11 dpf. GFP expression in the CNS and ICM is maintained at the latest stage we have examined in detail. Autofluorescence is also seen in the gut. (I) 11 dpf, high magnification view of the pronephric region. Round GFP-expressing cells are visible in this region, the site of hematopoiesis through adulthood. The diffuse fluorescence in the lower half of the micrograph is autofluorescence in the gut. |
Reprinted from Developmental Biology, 307(2), Zhang, X.Y., and Rodaway, A.R., SCL-GFP transgenic zebrafish: In vivo imaging of blood and endothelial development and identification of the initial site of definitive hematopoiesis, 179-194, Copyright (2007) with permission from Elsevier. Full text @ Dev. Biol.