
Fig. 3
- ID
- ZDB-FIG-061121-3
- Publication
- Mann et al., 2006 - Comparison of neurolin (ALCAM) and neurolin-like cell adhesion molecule (NLCAM) expression in zebrafish
- Other Figures
- All Figure Page
- Back to All Figure Page
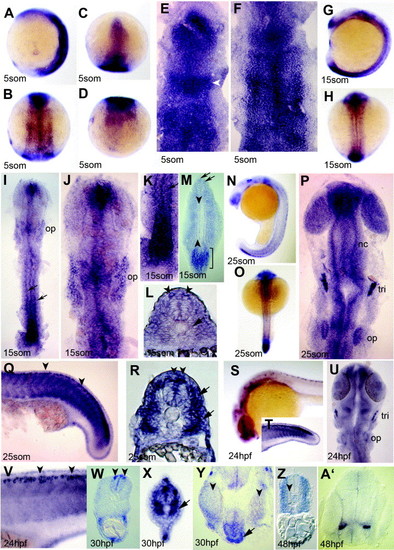
Expression of NLCAM during somitogenesis. (A–F) Basal expression throughout 5 som stage embryos with regions of distinction. Anterior head region expresses more highly, as does mid-hindbrain band (C and E; arrowhead). Irregular transverse zones of higher expression are evident in the neural plate (B and F), whereas the tailbud expresses weakly (A and D). Wholemounts in (A–D) and flatmounts in (E and F) anterior to top; (A) is lateral view; (B and F) dorsal views of midbody; (C and E) dorsal views of the head; (D) dorsal view of the tail. (G–L) 15 som stage embryos viewed from lateral (G), dorsal (H), dorsal flatmount (I–K) and cryosections (L and M). A single dorso-ventral disc of expression is seen in the nose region (G, I, J), as well as higher staining at the level of the mid-hind brain boundary and developing otic placodes (G, I, J; op). Expression is high in the forming neural plate (G, I, K, M), but declines anteriorly to bilateral rows (I, K, arrows). (M) An oblique section at 15 som stage shows a portion of the posteriormost neural plate with high expression (M, bracket) with dorsal restriction in more anterior neural plate (M, arrows). Weak expression in somites flanks a clear zone in notochord and adaxial cells (M, arrowheads indicate left-hand row). (L) Midtrunk 15 som section shows bilateral cells in the dorsal CNS (L, arrowheads) as well as a reduced signal in adaxial cells (L, arrow). (N–R) The posterior neural plate also expresses highly at 25 som (lateral (N and Q) and dorsal (O and P) wholemounts (N and O) and flatmounts (P and Q); R yolk extension section). Neural crest (nc), anterior nasal and retinal regions express in the head at 25 som (P). Staining from this stage is also seen in Rohon-Beard neurons (Q and R arrowheads) and near recently migrated slow muscle fibres (Q and R, arrows). (S–V) Lateral view of 24 hpf embryos (S, T, V) and dorsal flatmount of head (U) show large reduction in NLCAM signal. Staining is observed in the developing eye, Rohon–Beard neurons (V, W, arrowheads) and trigeminal placode (tri). (W, X) Sections of 30 hpf embryo through yolk extension (W) and tail (X) regions to show Rohon–Beard neurons in the dorsal neural tube (arrowheads) and in muscles cells adjacent to the notochord (X). (Y) An oblique 30 hpf head frontal section showing pituitary signal (arrow) ventral to hypothalamus between the eyes (arrowheads). (Z, A′) By 48 hpf, a lower magnification section of yolk extension somites shows exclusion of NLCAM mRNA around the notochord but continued low level expression in most muscle (Z, arrowhead). An anterior head section shows localised signal in the telencephalon (A′). |
Reprinted from Gene expression patterns : GEP, 6(8), Mann, C.J., Hinits, Y., and Hughes, S.M., Comparison of neurolin (ALCAM) and neurolin-like cell adhesion molecule (NLCAM) expression in zebrafish, 952-963, Copyright (2006) with permission from Elsevier. Full text @ Gene Expr. Patterns