
FIGURE
Fig. 4
- ID
- ZDB-FIG-050630-5570
- Publication
- Thisse et al., 2001 - Expression of the zebrafish genome during embryogenesis (NIH R01 RR15402)
Fig. 4
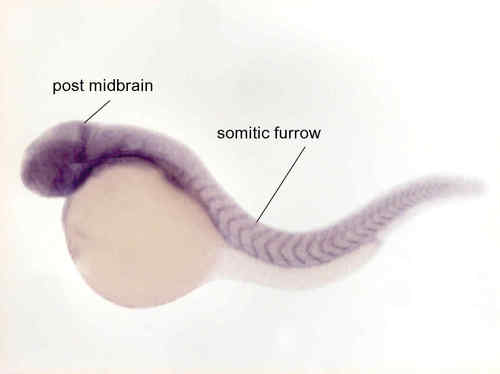
Basal level of expression but stronger in posterior midbrain, around the eye and in the olfactory. Strong expression at the border of myotomes, weak expression in pharyngeal arches. Decreasing in intensity compared to 24 hrs. |
Expression Data
| Gene: | |
|---|---|
| Fish: | |
| Anatomical Terms: | |
| Stage Range: | Prim-15 to Prim-25 |
| Probe: | cb2 Quality: |
| Supplier: | Zebrafish International Resource Center (ZIRC) (order this) |
Expression Detail
Antibody Labeling
Phenotype Data
Phenotype Detail
Acknowledgments
This image is the copyrighted work of the attributed author or publisher, and
ZFIN has permission only to display this image to its users.
Additional permissions should be obtained from the applicable author or publisher of the image.