
- Title
-
A novel eco-friendly Acinetobacter strain A1-4-2 for bioremediation of aquatic pollutants
- Authors
- Wang, R., Wang, J., Wang, L., Cai, Y., Wang, Y., Luo, H., Chen, B., Chen, J., Fang, J., Song, Z.
- Source
- Full text @ Sci. Rep.
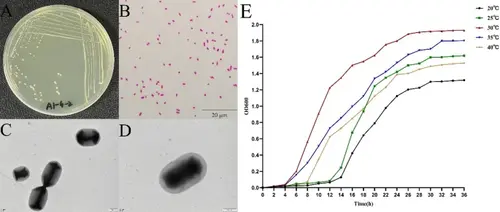
Characteristics of Strain A1-4-2, including A the colony appearance, B Gram stain, C, D scanning electron microscope images, and E growth curves at various temperatures |
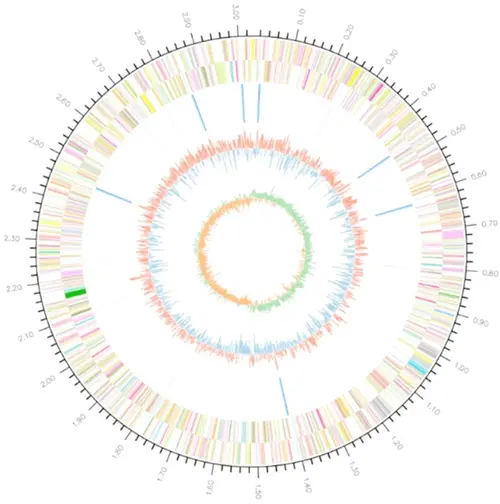
Diagram of Acinetobacter A1-4-2 genome. Genes on the forward (shown in the outer circle) and reverse (shown in the inner circle) strand are colored according to their cognate gene cluster (COG) categories: RNA genes are highlighted in different colors (blue for tRNA and red for rRNA), GC content is shown in yellow/blue, and GC shift is shown in orange/red |

Phylogeny of Acinetobacter strain and their related species based on 120 protein concentrates. The phylogenetic tree was constructed using all Acinetobacter strains from the NCBI RefSeq database, and this figure only show the subtree which is closely related to strain A1-4-2. The Acinetobacter clades are distinguished by different colors, with red representing Clade_I, blue representing Clade_II, orange representing Clade_III, green representing Clade_IV, and grey representing Clade_V. The nodes with black points mean the bootstrap values ≥ 80 |
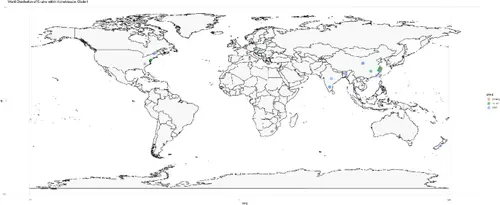
Environmental distribution of Acinetobacter Clade I. Pink represents strain A1-4-2, green represents isolated, and blue represents MAG |
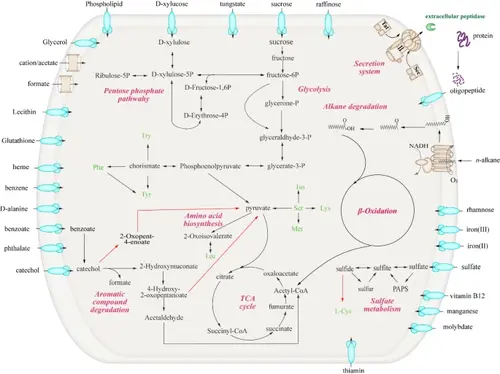
Metabolic potentials of strain A-4-2. The black arrows represent metabolic pathways predicted in strain A1-4-2 and the red arrows highlight the pathways in strain A1-4-2 that are absent in the other Acinetobacter strain |
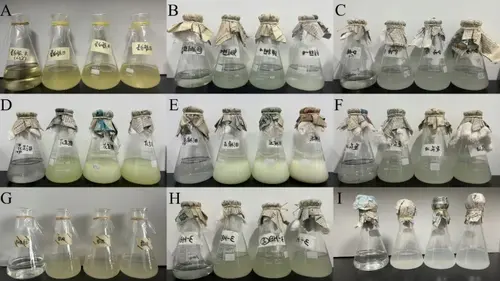
Substrate utilization profile of Strain A1-4-2. A peptone; B D-serine; C D-alanine; D peanut oil; E flax oil; F sunflower oil; G glycerol; H 3-hydroxybenzoic acid; I sodium benzoate. In each subplot, the bottle on the left represents the control group without uninoculation. At the time of initial inoculation, there was no visible difference in the transparency of the medium compared to the control group |