
Image
|
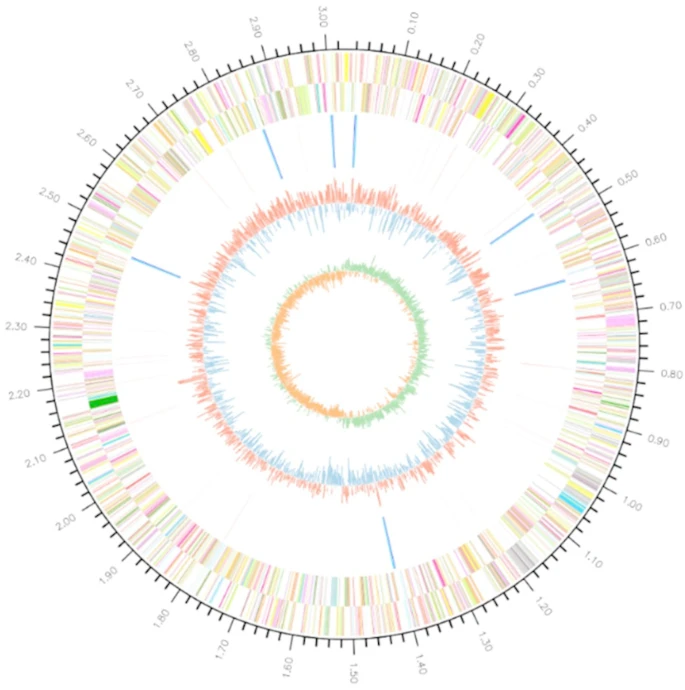
Figure Caption
Fig. 2 Diagram of Acinetobacter A1-4-2 genome. Genes on the forward (shown in the outer circle) and reverse (shown in the inner circle) strand are colored according to their cognate gene cluster (COG) categories: RNA genes are highlighted in different colors (blue for tRNA and red for rRNA), GC content is shown in yellow/blue, and GC shift is shown in orange/red
Acknowledgments
This image is the copyrighted work of the attributed author or publisher, and
ZFIN has permission only to display this image to its users.
Additional permissions should be obtained from the applicable author or publisher of the image.
Full text @ Sci. Rep.