
Image
|
Figure Caption
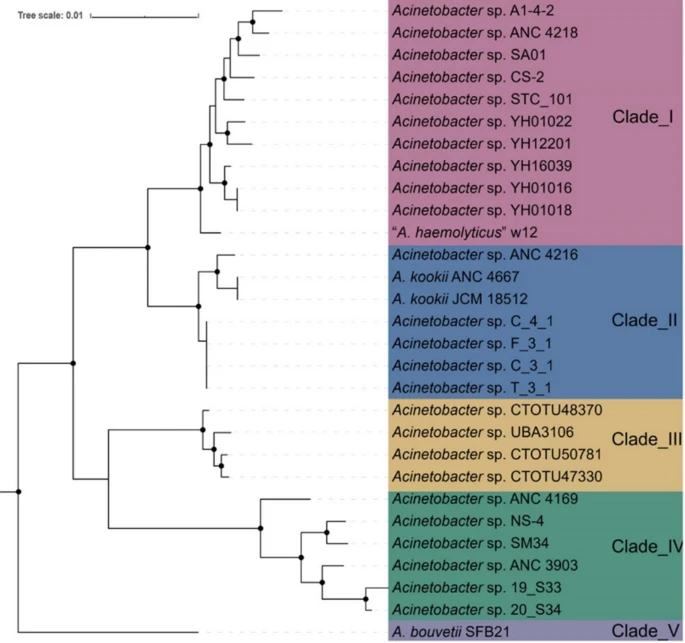
Fig. 3 Phylogeny of Acinetobacter strain and their related species based on 120 protein concentrates. The phylogenetic tree was constructed using all Acinetobacter strains from the NCBI RefSeq database, and this figure only show the subtree which is closely related to strain A1-4-2. The Acinetobacter clades are distinguished by different colors, with red representing Clade_I, blue representing Clade_II, orange representing Clade_III, green representing Clade_IV, and grey representing Clade_V. The nodes with black points mean the bootstrap values ≥ 80
Acknowledgments
This image is the copyrighted work of the attributed author or publisher, and
ZFIN has permission only to display this image to its users.
Additional permissions should be obtained from the applicable author or publisher of the image.
Full text @ Sci. Rep.