
- Title
-
The indispensable role of Mediator complex subunit 27 during neurodevelopment
- Authors
- Li, X., Yiliyaer, N., Guo, T., Zhao, H., Lei, Y., Gu, S.
- Source
- Full text @ Cell Biosci.
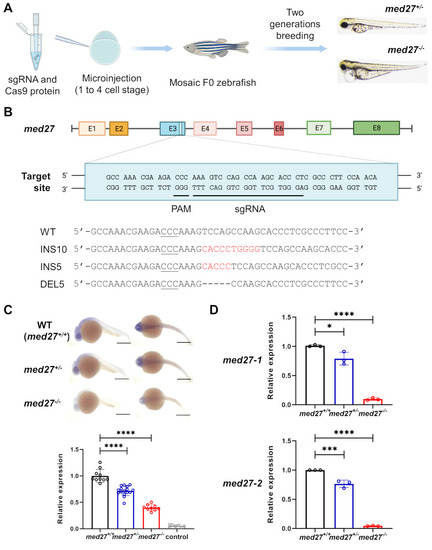
Generation of |
|
|
Rescue of |
|