
- Title
-
Therapeutic potential of a choline-zinc-vitamin E nutraceutical complex in ameliorating thioacetamide-induced nonalcoholic fatty liver pathology in zebrafish
- Authors
- Cao, B., Zhou, J., Xia, B., Li, X., Wang, R., Xu, Y., Li, C.
- Source
- Full text @ PLoS One
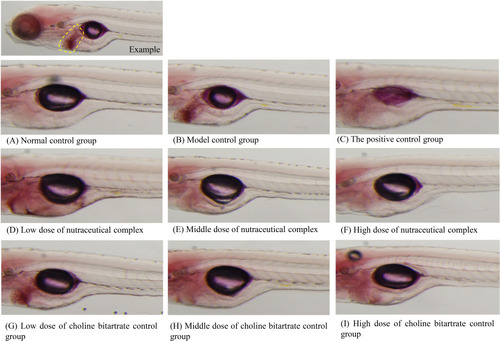
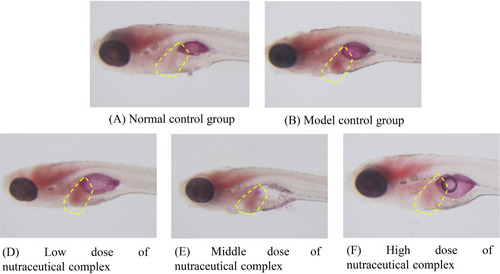
Intensity of zebrafish liver fat staining after treatment with nutraceutical complex. (A) Normal control group; (B) Model control group; (C) The positive control group: polyunsaturated phosphatidylcholine 50.0 μg/mL; (D) Low dose of nutraceutical complex: 125 μg/mL; (E) Middle dose of nutraceutical complex: 250 μg/mL; (F) High dose of nutraceutical complex: 500 μg/mL; (G) Low dose of choline bitartrate control group: 81.0 μg/mL; (H) Middle dose of choline bitartrate control group: 162 μg/mL; (I) High dose of choline bitartrate control group: 316 μg/mL. The location of the liver is marked with a yellow dotted line in the example figure. |
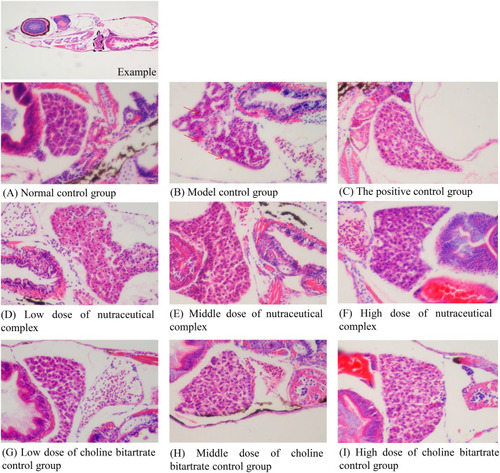
Liver tissue structure in zebrafish after treatment with nutraceutical complex. (A) Normal control group; (B) Model control group; (C) The positive control group: polyunsaturated phosphatidylcholine 50.0 μg/mL; (D) Low dose of nutraceutical complex: 125 μg/mL; (E) Middle dose of nutraceutical complex: 250 μg/mL; (F) High dose of nutraceutical complex: 500 μg/mL; (G) Low dose of choline bitartrate control group: 81.0 μg/mL; (H) Middle dose of choline bitartrate control group: 162 μg/mL; (I) High dose of choline bitartrate control group: 316 μg/mL. The black dashed box indicates the observed area in the example picture, and the red arrow points to vacuolar degeneration in the model control group. |
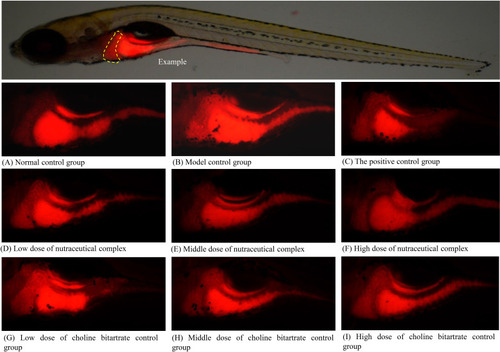
Fluorescence intensity graph of zebrafish liver fat after treatment with nutraceutical complex. (A) Normal control group; (B) Model control group; (C) The positive control group: polyunsaturated phosphatidylcholine 50.0 μg/mL; (D) Low dose of nutraceutical complex: 125 μg/mL; (E) Middle dose of nutraceutical complex: 250 μg/mL; (F) High dose of nutraceutical complex: 500 μg/mL; (G) Low dose of choline bitartrate control group: 81.0 μg/mL; (H) Middle dose of choline bitartrate control group: 162 μg/mL; (I) High dose of choline bitartrate control group: 316 μg/mL. Yellow dashed line indicates the liver. |
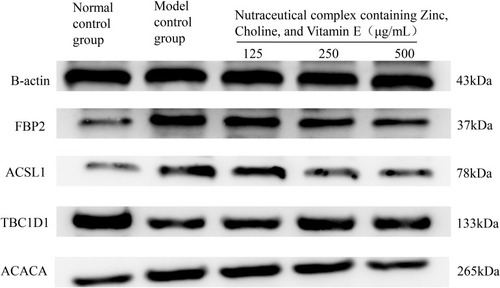
The protein expression of |
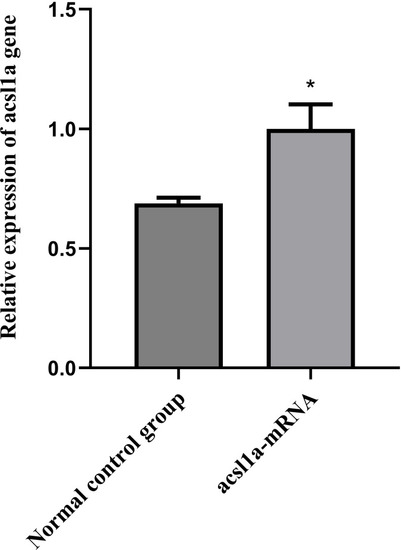
Relative expression of *Comparison with normal control group, |
Typical plot of zebrafish liver fat staining intensity after sample treatment. The yellow dashed box is the liver. |