
|
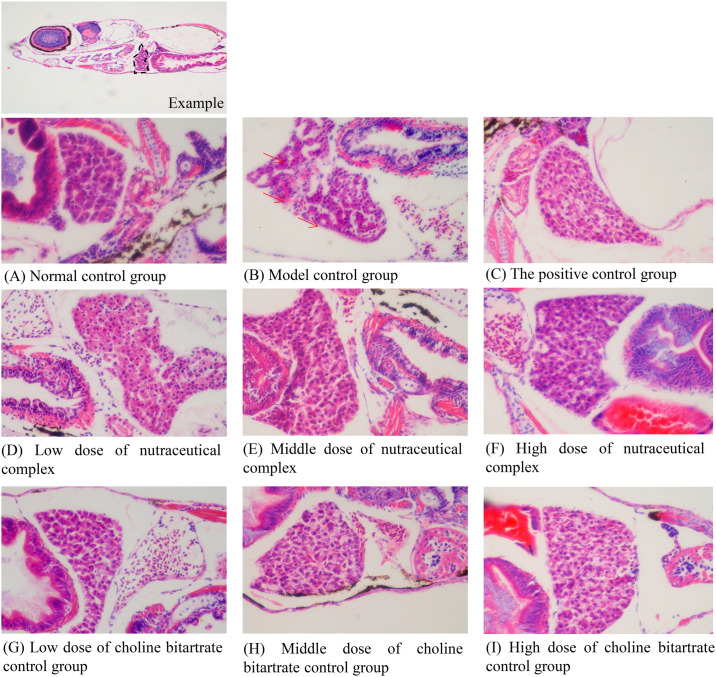
Fig 2 Liver tissue structure in zebrafish after treatment with nutraceutical complex.
(A) Normal control group; (B) Model control group; (C) The positive control group: polyunsaturated phosphatidylcholine 50.0 μg/mL; (D) Low dose of nutraceutical complex: 125 μg/mL; (E) Middle dose of nutraceutical complex: 250 μg/mL; (F) High dose of nutraceutical complex: 500 μg/mL; (G) Low dose of choline bitartrate control group: 81.0 μg/mL; (H) Middle dose of choline bitartrate control group: 162 μg/mL; (I) High dose of choline bitartrate control group: 316 μg/mL. The black dashed box indicates the observed area in the example picture, and the red arrow points to vacuolar degeneration in the model control group.