
Image
|
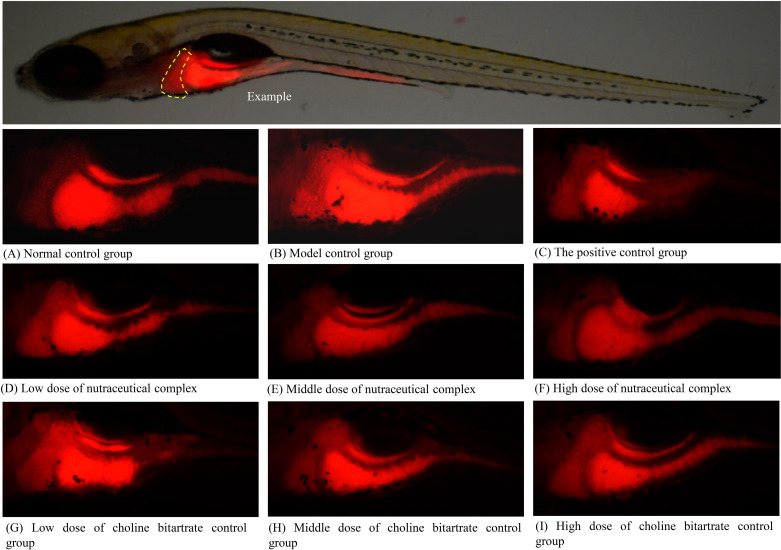
Figure Caption
Fig 3 Fluorescence intensity graph of zebrafish liver fat after treatment with nutraceutical complex.
(A) Normal control group; (B) Model control group; (C) The positive control group: polyunsaturated phosphatidylcholine 50.0 μg/mL; (D) Low dose of nutraceutical complex: 125 μg/mL; (E) Middle dose of nutraceutical complex: 250 μg/mL; (F) High dose of nutraceutical complex: 500 μg/mL; (G) Low dose of choline bitartrate control group: 81.0 μg/mL; (H) Middle dose of choline bitartrate control group: 162 μg/mL; (I) High dose of choline bitartrate control group: 316 μg/mL. Yellow dashed line indicates the liver.
Acknowledgments
This image is the copyrighted work of the attributed author or publisher, and
ZFIN has permission only to display this image to its users.
Additional permissions should be obtained from the applicable author or publisher of the image.
Full text @ PLoS One