
- Title
-
The ERBB2 c.1795C>T, p.Arg599Cys variant is associated with left ventricular outflow tract obstruction defects in humans
- Authors
- Ampuja, M., Ericsson, S., Paatero, I., Chowdhury, I., Villman, J., Broberg, M., Ramste, A., Balboa, D., Ojala, T., Chong, J.X., Bamshad, M.J., Priest, J.R., Varjosalo, M., Kivelä, R., Helle, E.
- Source
- Full text @ HGG Adv
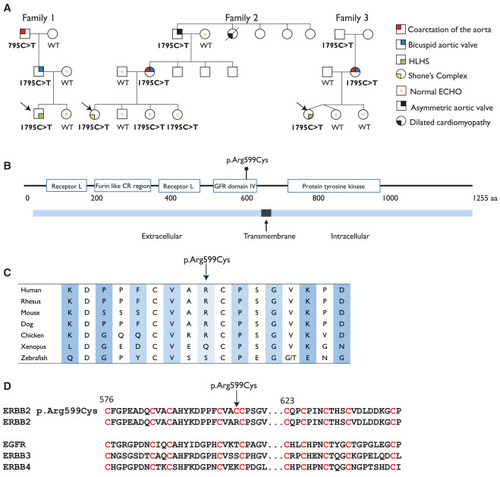
ERBB2 c.1795C>T variant and pedigrees of the affected families (A) Pedigrees of the three affected families. Arrows indicate the probands in each family. (B) The p.Arg599Cys variant is located in the extracellular GFR domain IV of ERBB2. (C) ERBB2 protein sequence conservation around the variant site. (D) Protein sequence alignment of the four members of the EGFR family and the ERBB2 p.Arg599Cys mutant showing conservation of the cysteine sites in the four WT receptors, and addition of an extra cysteine in the ERBB2 p.Arg599Cys mutant. |
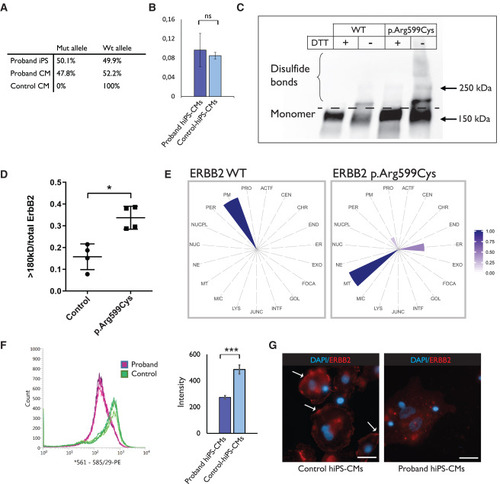
ERBB2 p.Arg599Cys variant results in protein mislocalization (A) Digital PCR confirms that the variant allele accounts for half of the ERBB2 expression levels in proband-hiPSCs (three technical replicates from one sample) and hiPS-CMs (three technical replicates from a representative sample of three different CM differentiations), whereas the hiPS-CMs from a control subject (HEL47.2) have 100% expression of the WT allele (three technical replicates from one sample). (B) Simple western shows that there is no difference in the ERBB2 phosphorylation levels between proband hiPS-CMs and hiPS-CMs from a control subject (HEL47.2) (three replicates from one proband and one healthy hiPS-CM differentiation). Results are presented as mean with standard deviation. (C) Cos-7 cells were transfected with either ERBB2 WT or ERBB2 c.1795C>T plasmid. Leaving out the reducing agent (DTT) from the western blot reveals the ERBB2-protein complexes that are larger due to intact disulfide bonds. (D) Quantification of the disulfide bonds from the western blot shows higher amount of disulfide crosslinks in for the ERBB2 p.Arg599Cys receptor. Results are presented as mean with standard error of the mean (experiment was repeated four times with one replicate in each experiment). (E) MS microscopy shows differences in the predicted cellular location for the ERBB2 WT and ERBB2 p.Arg599Cys receptor (results are from three replicates). (F) Flow cytometry with a PE-conjugated antibody that recognizes the extracellular part of ERBB2, and quantification of the intensities in the proband hiPS-CMs and two control hiPS-CMs (experiment repeated three times) indicate reduced levels of ERBB2 in proband hiPS-CMs (∗∗∗p < 0.005, Mann-Whitney statistical test). Results are presented as mean with standard deviation. (G) Control hiPS-CMs have more ERBB2 staining in the plasma membrane compared with proband hiPS-CMs (representative images from two technical replicates from one staining). Arrows point to plasma membrane staining. Scale bar, 25 μm. |
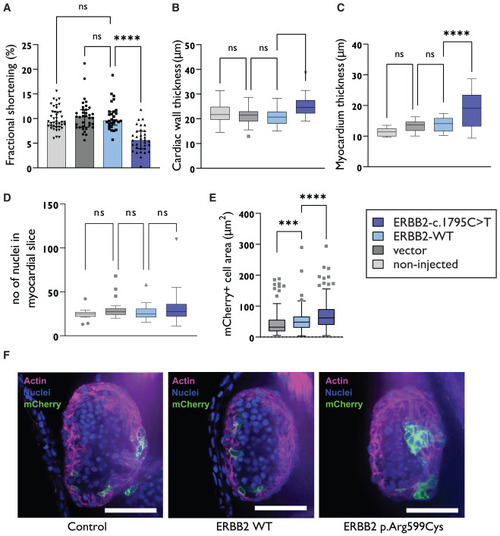
ERBB2 variant results in compromised heart function in zebrafish (A) Fractional shortening of the heart of the zebrafish embryos injected with the ERBB2 c.1795C>T plasmid (33 embryos), ERBB2 WT plasmid (29 embryos), empty vector (36 embryos), and no injection (41 embryos) indicate decreased pump function in the zebrafish embryos injected with the ERBB2 c.1795C>T plasmid. Median with interquartile range is presented. (B) Increased cardiac wall thickness as measured from brightfield videos (non-injected, n = 42 embryos; vector, n = 39 embryos; ERBB2 WT, n = 30 embryos; ERBB2 c.1795C>T, n = 33 embryos. (C) Increased myocardium thickness measured by phalloidin staining was seen in the zebrafish embryos injected with the ERBB2 c.1795C>T plasmid (uninjected, n = 18 embryos; vector, n = 22 embryos; ERBB2 WT, n = 22 embryos; ERBB2 c.1795C>T, n = 22 embryos). (D) No differences in the number of myocardial nuclei within the four experimental groups was seen (14 uninjected embryos, 22 empty vector embryos, 20 WT ERBB2 embryos, 19 c.1795C>T embryos). Myocardium was identified based on anatomical location and phalloidin staining. (E) Myocardial cell area measured by membrane localized mCherry-CAAX staining in each group indicated slightly enlarged cells in the zebrafish embryo injected with the ERBB2 WT (212 cardiomyocytes from 16 embryos), ERBB2 c.1795C>T plasmid (262 cardiomyocytes from 20 embryos) or only empty vector injected embryos (151 cardiomyocytes from 19 embryos). (F) Example images of phalloidin staining of the heart. The ventricle lumen is filled with red blood cells (zebrafish red blood cells are nucleated) and myocardium identified with phalloidin staining. Scale bar, 50 μm. Statistical tests have been done using the Kruskal-Wallis test, ∗∗∗∗p < 0.0001, ∗∗∗p < 0.001. (B)–(D) are presented as Tukey Box and Whiskers. |
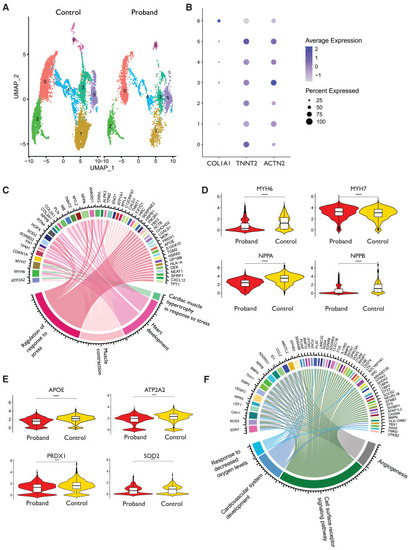
Proband and control hiPS-CM and hiPS-EC transcriptomics (A) Uniform Manifold Approximation and Projection (UMAP) of proband hiPS-CMs and healthy control hiPS-CMs. The samples (one replicate each) consist of one proband hiPS-CM sample (from family 1 proband) and four control samples combined. (B) Dot plot shows clusterwise expression of cardiomyocyte marker genes TNNT2 and ACTN2 and the fibroblast marker COL1A1. (C) Circos plot of pathways that are differentially expressed in proband hiPS-CMs according to GO analysis. (D and E) Violin plots presenting the expression levels of (D) heart development and (E) oxidative stress-related genes in proband-hiPS-CMs and control hiPS-CMs. (F) Circos plot of pathways that are differentially expressed in proband-hiPS-ECs as compared with hiPS-ECs of healthy controls. Samples consist of two replicates from the proband hiPS-ECs and two replicates from three control hiPS-ECs. For statistical tests, false discovery rate has been applied. |