
|
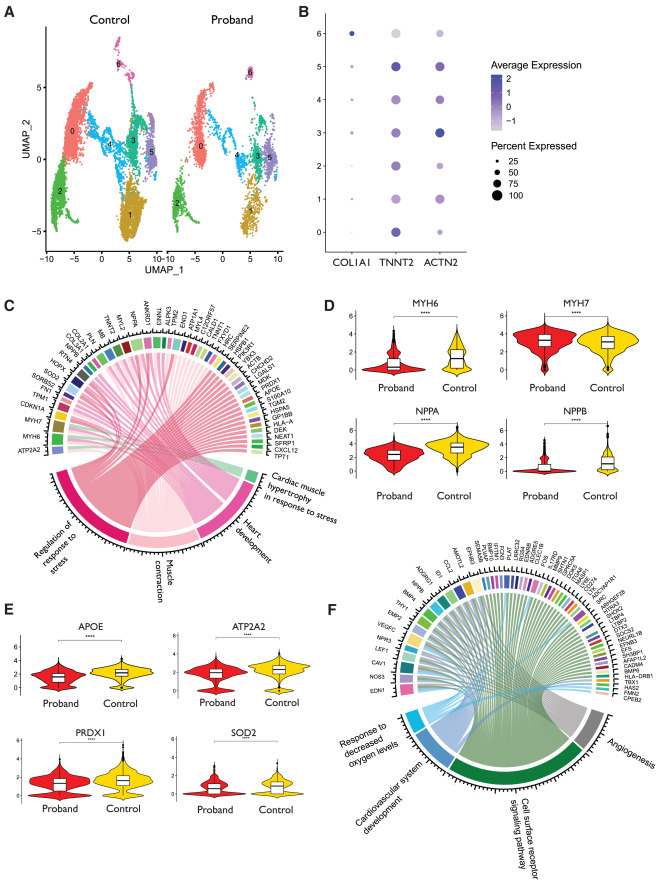
Fig. 4 Proband and control hiPS-CM and hiPS-EC transcriptomics (A) Uniform Manifold Approximation and Projection (UMAP) of proband hiPS-CMs and healthy control hiPS-CMs. The samples (one replicate each) consist of one proband hiPS-CM sample (from family 1 proband) and four control samples combined. (B) Dot plot shows clusterwise expression of cardiomyocyte marker genes TNNT2 and ACTN2 and the fibroblast marker COL1A1. (C) Circos plot of pathways that are differentially expressed in proband hiPS-CMs according to GO analysis. (D and E) Violin plots presenting the expression levels of (D) heart development and (E) oxidative stress-related genes in proband-hiPS-CMs and control hiPS-CMs. (F) Circos plot of pathways that are differentially expressed in proband-hiPS-ECs as compared with hiPS-ECs of healthy controls. Samples consist of two replicates from the proband hiPS-ECs and two replicates from three control hiPS-ECs. For statistical tests, false discovery rate has been applied.