
Fig. 2
- ID
- ZDB-FIG-250806-15
- Publication
- Ampuja et al., 2025 - The ERBB2 c.1795C>T, p.Arg599Cys variant is associated with left ventricular outflow tract obstruction defects in humans
- Other Figures
- All Figure Page
- Back to All Figure Page
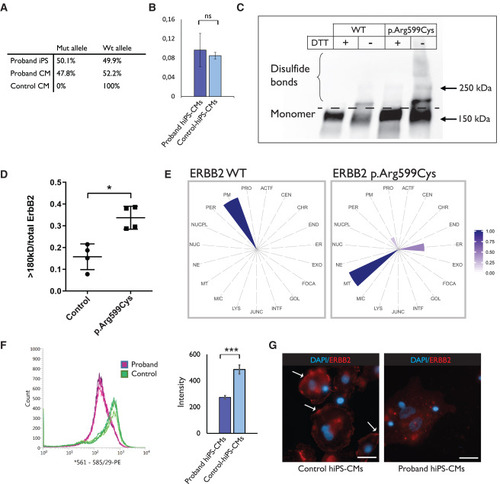
ERBB2 p.Arg599Cys variant results in protein mislocalization (A) Digital PCR confirms that the variant allele accounts for half of the ERBB2 expression levels in proband-hiPSCs (three technical replicates from one sample) and hiPS-CMs (three technical replicates from a representative sample of three different CM differentiations), whereas the hiPS-CMs from a control subject (HEL47.2) have 100% expression of the WT allele (three technical replicates from one sample). (B) Simple western shows that there is no difference in the ERBB2 phosphorylation levels between proband hiPS-CMs and hiPS-CMs from a control subject (HEL47.2) (three replicates from one proband and one healthy hiPS-CM differentiation). Results are presented as mean with standard deviation. (C) Cos-7 cells were transfected with either ERBB2 WT or ERBB2 c.1795C>T plasmid. Leaving out the reducing agent (DTT) from the western blot reveals the ERBB2-protein complexes that are larger due to intact disulfide bonds. (D) Quantification of the disulfide bonds from the western blot shows higher amount of disulfide crosslinks in for the ERBB2 p.Arg599Cys receptor. Results are presented as mean with standard error of the mean (experiment was repeated four times with one replicate in each experiment). (E) MS microscopy shows differences in the predicted cellular location for the ERBB2 WT and ERBB2 p.Arg599Cys receptor (results are from three replicates). (F) Flow cytometry with a PE-conjugated antibody that recognizes the extracellular part of ERBB2, and quantification of the intensities in the proband hiPS-CMs and two control hiPS-CMs (experiment repeated three times) indicate reduced levels of ERBB2 in proband hiPS-CMs (∗∗∗p < 0.005, Mann-Whitney statistical test). Results are presented as mean with standard deviation. (G) Control hiPS-CMs have more ERBB2 staining in the plasma membrane compared with proband hiPS-CMs (representative images from two technical replicates from one staining). Arrows point to plasma membrane staining. Scale bar, 25 μm. |