
- Title
-
2,5-Dihydroxyphenylethanone: an anti-melanogenic bioactive compound isolated from Ganoderma cochlear
- Authors
- Ning, M., Liu, X.C., He, M., Peng, X.R., Qiu, M.H.
- Source
- Full text @ J Enzyme Inhib Med Chem

The chemical structure of 22 compounds evaluated for anti-melanogenic activity. |

Docking results of compound Q1-Q12 with tyrosinase. Green dotted line represents hydrogen bond, light pink dotted line represents hydrophobic interaction, grey dotted line represents electrostatic interaction, the pink dotted line represents the π–π interaction, the purple dotted line represents the π–σ interaction, the red dotted line indicates unfavourable factors. |
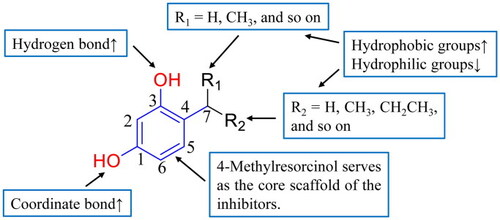
The structure-activity relationship (SAR) of mushroom tyrosinase inhibitors. “↑” indicates enhanced inhibitory effect, “↓” denotes reduced inhibitory effect. |

(A) the bar chart of melanin signal intensity in zebrafish head, (B) the whitening efficacies of zebrafish at different concentrations, (C) the results of inhibition of melanin formation in zebrafish by some compounds. Compared with the normal control group, * |

A: the bar chart of melanin signal intensity in zebrafish head, B: the whitening efficacies of zebrafish at different concentrations. Compared with the normal control group, * |

The structure-activity relationship (SAR) of anti-melanogenic compounds. 1: (A) the most potent compounds; (B) moderately to highly effective ones. 2: “↑” indicates enhanced inhibitory effect, “↓” denotes reduced inhibitory effect, “*” represents no significant change in inhibitory activity. |

The possible mechanisms of inhibiting melanin synthesis. |