
Image
|
Figure Caption
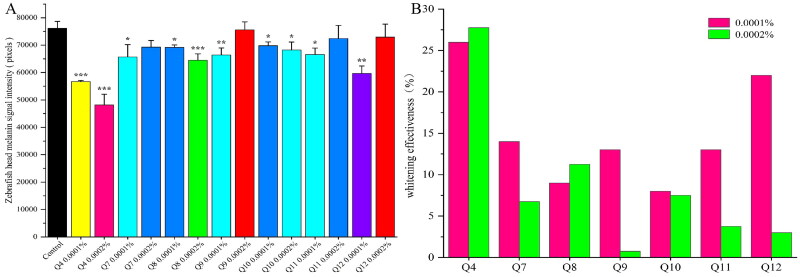
Figure 5.
A: the bar chart of melanin signal intensity in zebrafish head, B: the whitening efficacies of zebrafish at different concentrations. Compared with the normal control group, *
Acknowledgments
This image is the copyrighted work of the attributed author or publisher, and
ZFIN has permission only to display this image to its users.
Additional permissions should be obtained from the applicable author or publisher of the image.
Full text @ J Enzyme Inhib Med Chem