FIGURE SUMMARY
Title

Colorectal cancer progression to metastasis is associated with dynamic genome-wide biphasic 5-hydroxymethylcytosine accumulation

Authors
Murcott, B., Honig, F., Halliwell, D.O., Tian, Y., Robson, J.L., Manasterski, P., Pinnell, J., Dix-Peek, T., Uribe-Lewis, S., Ibrahim, A.E.K., Sero, J., Gurevich, D., Nikolaou, N., Murrell, A.
Source
Full text @ BMC Biol.

5hmC levels are increased in liver metastasis tissue compared to primary colon tumours in CRC. A Mass spectrometer analysis for global 5-methylcytosine (5mC) and 5-hydroxymethylcytosine (5hmC) levels in DNA from 14 normal colon (NC) tissues from CRC patients; 15 tumours in colon (TC) and 10 metastases to liver tumours (LT), showing global demethylation with CRC progression for 5mC. By contrast global 5hmC in metastasis increases compared to the primary cancers. Boxplots depict median and interquartile ranges and standard deviation. ***P < 0.005. Supporting data values are in Additional file 6. B RNA-seq data downloaded [28], showing normalised read counts for TET transcripts in normal colon (NC), tumour colon (TC) and metastasised to liver tumours metastasis (LT). Error bars represent standard deviation around the mean. C Kaplan-Meier plots for time (years) to metastasis generated from the Loboda Yeatman study of colon cancer [29, 30], dividing patients into high or low risk for metastasis depending on TET2/TET3 expression. Concordance index = 57.87, log-rank equal curves P = 0.1093, R^2 = 0.166/0.994. Risk groups hazard ratio = 1.83 (conf. int 0.86–3.86). D TET2 and TET 3 expression in these high and low metastasis risk groups. Patients with high risk of metastasis have higher expression of TET (P = 0.000333); no significant difference for TET3 expression (P = 0.965127)

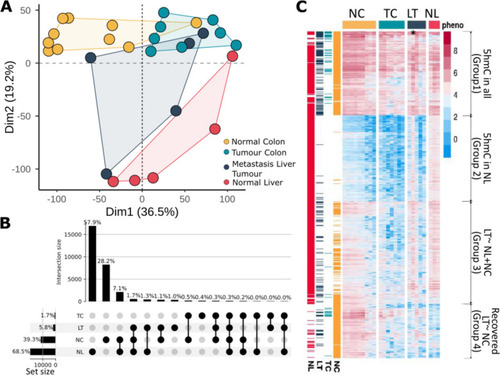
5hmC profiles in liver metastasis and colon are similar. Colour scheme: yellow normal colon tissue from CRC patients (NC); light blue primary tumour in colon (TC); dark blue metastasised to liver tumours (LT); red normal liver (NL). A Principal component analysis plot showing distinct clustering between NC (n = 9), TC (n = 8), NL (n = 5) and LT (n = 5). B Upset plot showing the overlap of 5hmC peaks in normal and tumour tissues. C Heatmap of 5hmC profiles during CRC tumour progression; first four columns depict average 5hmC levels in each of NL, LM, CT and NC. Subsequent columns depict individual patient samples grouped by tissue type. Four distinct clusters are present: group 1 5hmC presence in all samples; group 2 5hmC present in NL only; group 3 liver metastasis with similarities to both NC and NL; and group 4 recovery of 5hmC in LT matching NC. Star * highlights patient sample LT51, which looks very similar to normal liver

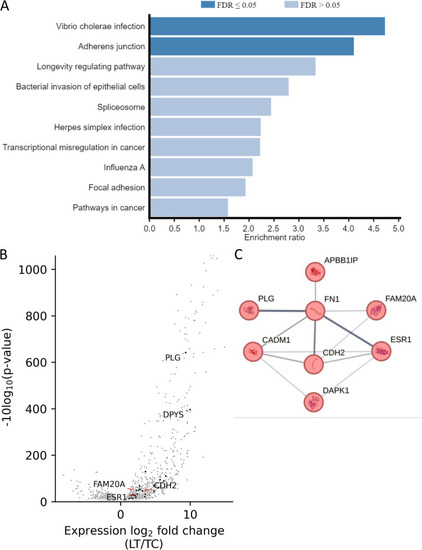
5hmC peaks associated with differential gene expression. A KEGG analysis of 5hmC marked genes that gain 5hmC in liver metastasis. B Volcano plot for gene expression changes after metastatic transition (data from [28]). Darker dots identify genes with at least one overlapping and significantly enriched 5hmC peak in hMeDIP-seq. C A core cadherin 2 (CDH2) and fibrinogen (FN1) network of associations for genes that have increased 5hmC and upregulated expression during metastasis

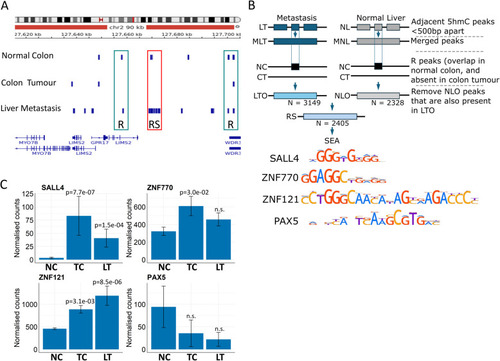
In liver metastasis, 5hmC peaks that were initially present in normal colon are recovered. A IGV screenshot with uploaded tracks of 5hmC consensus peaks for normal colon, colon tumour and liver metastasis. Boxes above R highlight a 5hmC peak that has ‘recovered’ since it is present in normal colon, absent in colon tumours and reappears in liver metastasis. Boxes above RS highlight a 5hmC peak that has ‘recovered and spread’. Thus, the peak is present in normal colon, lost in tumour colons and reappears in metastasis, but also spreads to adjacent sites. B The strategy for identifying RS peaks and the consensus binding sites for SALL4, ZNF770, ZNF121 and PAX5 identified after SEA. Abbreviations: MLT and MNL are Merged liver tumour (LT) and normal liver (NL) peaks respectively. LTO and NLO are LT or NL peaks that Overlap normal colon. C Normalised RNAseq counts (data used [28]) for SALL4, ZNF770, ZNF121 and PAX5 in normal colon, colon tumours and liver metastasis (NC, CT and LM). Wald test, Benjamini-Hochberg adjusted. Error bars represent ± SEM. Supporting PCR data values in Additional file 6

Acknowledgments
This image is the copyrighted work of the attributed author or publisher, and ZFIN has permission only to display this image to its users. Additional permissions should be obtained from the applicable author or publisher of the image. Full text @ BMC Biol.