IMAGE

Fig. 2

ID
ZDB-IMAGE-250418-4
Source
Figures for Murcott et al., 2025
Image
Figure Caption

Fig. 2

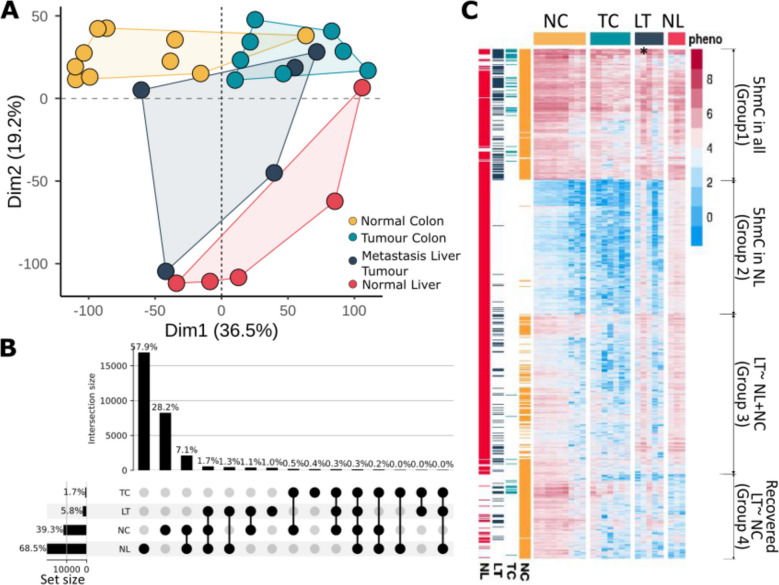
5hmC profiles in liver metastasis and colon are similar. Colour scheme: yellow normal colon tissue from CRC patients (NC); light blue primary tumour in colon (TC); dark blue metastasised to liver tumours (LT); red normal liver (NL). A Principal component analysis plot showing distinct clustering between NC (n = 9), TC (n = 8), NL (n = 5) and LT (n = 5). B Upset plot showing the overlap of 5hmC peaks in normal and tumour tissues. C Heatmap of 5hmC profiles during CRC tumour progression; first four columns depict average 5hmC levels in each of NL, LM, CT and NC. Subsequent columns depict individual patient samples grouped by tissue type. Four distinct clusters are present: group 1 5hmC presence in all samples; group 2 5hmC present in NL only; group 3 liver metastasis with similarities to both NC and NL; and group 4 recovery of 5hmC in LT matching NC. Star * highlights patient sample LT51, which looks very similar to normal liver

Acknowledgments
This image is the copyrighted work of the attributed author or publisher, and ZFIN has permission only to display this image to its users. Additional permissions should be obtained from the applicable author or publisher of the image. Full text @ BMC Biol.