FIGURE SUMMARY
Title

Gastroesophageal circulating tumor cell crosstalk with peripheral immune system guides CTC survival and proliferation

Authors
Rossi, T., Valgiusti, M., Puccetti, M., Miserocchi, G., Zanoni, M., Angeli, D., Arienti, C., Pace, I., Bassi, C., Vannini, I., Melloni, M., Bandini, E., Urbini, M., Negrini, M., Bonafè, M., Ferracin, M., Gallerani, G.
Source
Full text @ Cell Death Dis.

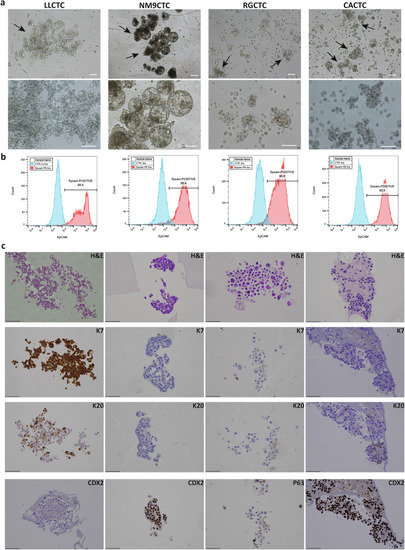
Morphological and phenotypic characteristics of cultured CTCs.

a Representative images of the four CTC-derived cell lines. Tumoroid structures can be noticed in all cell lines (black arrows). 5x (upper) and 10x (lower) magnification, phase contrast, scalebar 100 µm. b FACS analysis of EpCAM-positive cell populations (red curve) and negative control (cyan curve) The percentage of EpCAM+ cells is indicated. c Histological characterization of CTC-derived cell lines. Panels show cellular staining with hematoxylin/eosin (H&E), cytokeratin-7 (K7), cytokeratin-20 (K20), caudal type homeobox 2 (CDX2) and tumor protein p63.

Invasive competence of CTC-derived cell lines in in-vivo zebrafish model.

a Temporal monitoring of the percentage of embryos with CTC intravasation. b Representative images of engrafted zebrafish with tumor cells shed in the circulation 24 h post-injection (c) Representative images of tumor cell contacts with the circulatory system near the site of injection. At 24 h, sprouting vessel formations are visible, in addition to circulating CTCs. d Representative image of metastases formation 48 h post-injection. Green: zebrafish endothelial cells, red: CTC-derived tumor cells.

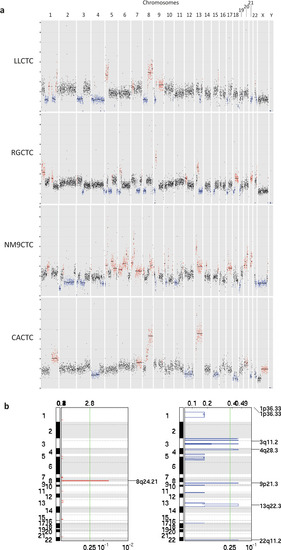
Genomic landscape of the four CTC-derived cell lines.

a Graphical representation of CTC cell line copy number aberration (CNA) distribution across all chromosomes. Red dots represent amplifications, blue dots represent deletions (b) Significant copy number gains (red) and losses (blue) detected by GISTIC 2.0 (shown as peaks) shared between the cell lines.

Gene expression analysis of the four CTC-derived cell lines.

a Unsupervised principal component analysis (PCA) of the gene expression profiles of 4 CTC cell lines (each one in triplicate) and TGCA esophageal (ESCA) and stomach (STAD) cancer samples. b Hallmark GSEA comparison of CTC-derived cell lines versus TGCA dataset of GEC primary tumors showing normalized enrichment scores for the represented genesets (FDR < 25%, p-value < 0.01). Red: genesets enriched in CTC cell lines; blue: genesets enriched in primary GECs c Hallmark GSEA comparison of in-vivo non-invasive CTC-derived cell line (CACTC) versus in-vivo invasive CTC-derived cell lines (RGCTC, LLCTC and NM9CTC) showing normalized enrichment scores for the represented genesets (FDR < 25%, p-value < 0.01). Red: genesets enriched in non-invasive CTC cell line; blue genesets enriched in invasive CTC cell lines (d) Histogram representing somatic mutations detected in at least two cell lines. The different colors indicate different groups of cell lines.

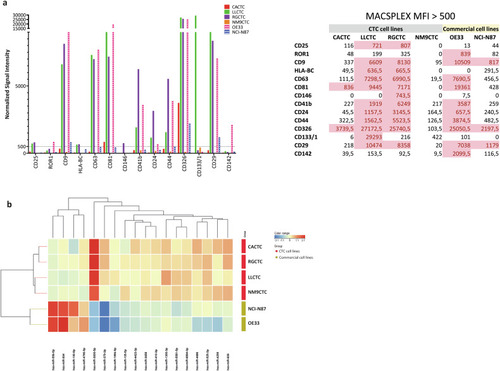
Characterization of extracellular vesicles secreted by cell lines.

a Phenotypic characterization of extracellular vesicles isolated from supernatant of exhausted culture media of cell lines obtained by FACS analysis. Histograms represent the mean fluorescence intensity (MFI) of the detected membrane proteins with values > 500 in at least one of the samples. MFI values are reported in the side table. b Cluster analysis and heatmap representation of CTC and commercial GEC cell lines based on the 14 miRNAs contained into EV and differentially expressed between the two groups.

Characterization of immune cell differentiation in co-cultures.

a Schematic representation of the co-culture (bioreactor): Isolated PBMCs were seeded in the 3D compartment, while enriched CTCs are seeded in-suspension (2D) with residual PBMCs. After 30 days, proliferating CTCs are visible (brightfield images) and differentiated monocytes are evident both in the 3D scaffold (cells are immune-stained with DAPI, blue) and at the bottom of the ultra-low attachment well (cells are stained with phalloidin, red, and counterstained with DAPI, blue). b Leukocyte differentiation at the bottom of the well is dependent on the presence of differentiated leukocytes in the 3D scaffold. When seeded without the 3D compartment, leukocytes do not differentiate (adhere at the bottom of the ultra-low attachment well) (2D PBMC w/o 3D PBMC), but rather persist in-suspension and then die in about 30 days. Leukocytes in 2D compartment adhere and differentiate only in the presence of differentiated leukocytes in the 3D compartment (2D PBMC w/ 3D PBMC). c Representative immunofluorescence staining of differentiated leukocytes in the 2D-compartment indicating differentiated monocytes with a mixed population of macrophages M2-like profile (CD206 + /CD163 + ) and M1-like profile (CD11c + ), nuclei are in blue. d Representative images confirming the differentiation of monocytes into macrophages in patient co-cultures, Cells multinucleation were verified through the cell-cell fusion marker CD13 (red), CD146 (yellow) as a monocyte-derived subtype of macrophages and CD3 (green) to discriminate any residual T-lymphocyte. e Expression of cell type or lineage-specific genes including ACTA2, PDGFRb (fibroblasts/myofibroblasts), CD163, CD206 (macrophages) and CD14, CD45 as monocyte lineage, using Digital PCR. Expression analysis revealed a mixed population of CD163 + /CD206+ macrophages and fibroblast-like cells ACTA2/PDGFRb+ on 3D compartments seeded with patient’s PBMCs (with, plain colours, or without proliferating CTCs checkered pattern).

Acknowledgments
This image is the copyrighted work of the attributed author or publisher, and ZFIN has permission only to display this image to its users. Additional permissions should be obtained from the applicable author or publisher of the image. Full text @ Cell Death Dis.