IMAGE

Fig. 1

ID
ZDB-IMAGE-250403-36
Source
Figures for Rossi et al., 2025
Image
Figure Caption

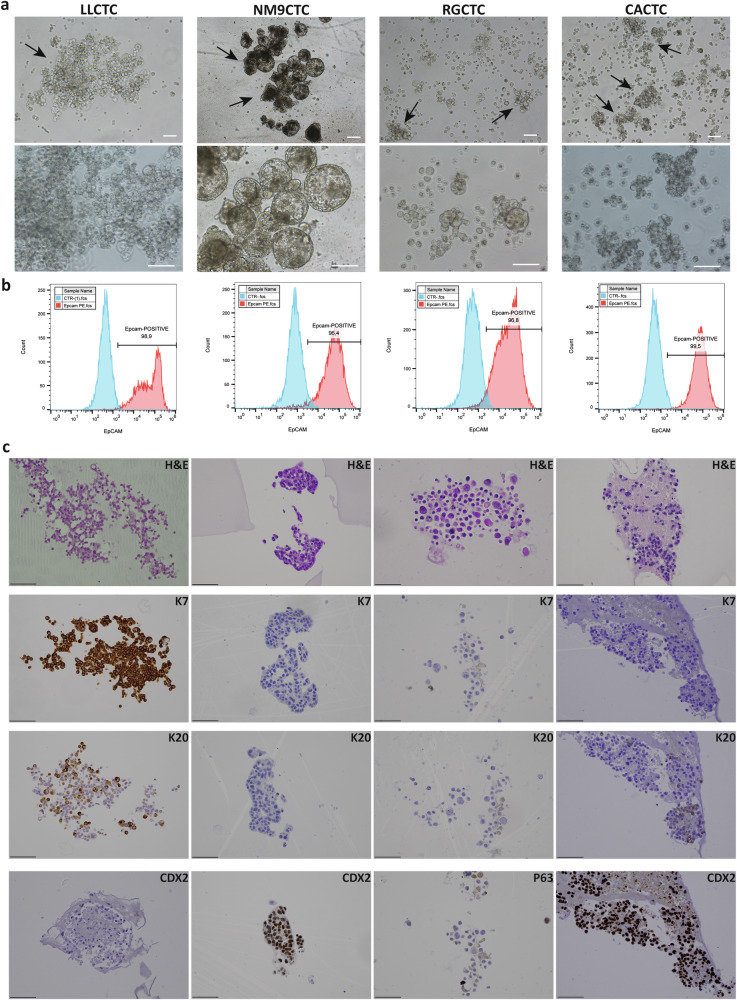
Fig. 1 Morphological and phenotypic characteristics of cultured CTCs.

a Representative images of the four CTC-derived cell lines. Tumoroid structures can be noticed in all cell lines (black arrows). 5x (upper) and 10x (lower) magnification, phase contrast, scalebar 100 µm. b FACS analysis of EpCAM-positive cell populations (red curve) and negative control (cyan curve) The percentage of EpCAM+ cells is indicated. c Histological characterization of CTC-derived cell lines. Panels show cellular staining with hematoxylin/eosin (H&E), cytokeratin-7 (K7), cytokeratin-20 (K20), caudal type homeobox 2 (CDX2) and tumor protein p63.

Acknowledgments
This image is the copyrighted work of the attributed author or publisher, and ZFIN has permission only to display this image to its users. Additional permissions should be obtained from the applicable author or publisher of the image. Full text @ Cell Death Dis.