
- Title
-
Synergistic endocrine disruption and cellular toxicity of polyethylene microplastics and bisphenol A in MLTC-1 cells and zebrafish
- Authors
- Ye, T., Yang, R., He, S., Li, J., Liu, Y., Li, C., Luo, H.
- Source
- Full text @ Sci. Rep.
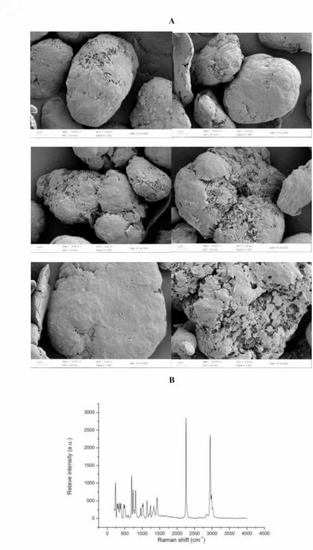
Composition and morphology characterization of the microplastics. Note: (A): Microscopic morphology of the surface of PE-MPs using a scanning electron microscope, Magnification: 10.00 KX; (B): The composition of the PE-MPs using a microscopic raman spectrometer. |
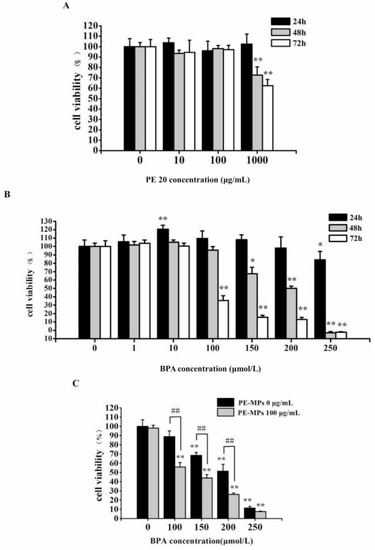
Effects of BPA and PE-MPs on the cell viablility of MLTC-1 cells. Note: (A): Effects of PE-MPs on the cell viablility of MLTC-1 cells; (B): Effects of BPA on the cell viablility of MLTC-1 cells; (C): Effects of BPA and PE-MPs on the cell viablility of MLTC-1 cells; Results are expressed as mean ± standard deviation (n = 3). *P < 0.05, **P < 0.01 indicate significant differences between the exposure group and the control. #P < 0.05, ##P < 0.01 indicates the significant differences between BPA and BPA + PE-MPs treatment group. |

Effects of BPA and PE-MPs on the cell cycle of MLTC-1 cells. Note: Results are expressed as mean ± standard deviation (n = 3). *P < 0.05, **P < 0.01 indicate significant differences between the exposure group and the control. #P < 0.05, ##P < 0.01 indicates the significant differences between BPA and BPA + PE-MPs treatment group. |

Effects of BPA and PE-MPs on the apoptosis of MLTC-1 cells. Note: Results are expressed as mean ± standard deviation (n = 3). *P < 0.05, **P < 0.01 indicate significant differences between the exposure group and the control. #P < 0.05, ##P < 0.01 indicates the significant differences between BPA and BPA + PE-MPs treatment group. |

Effects of BPA and PE-MPs on the mitochondrial membrane potential of MLTC-1 cells. Note: Results are expressed as mean ± standard deviation (n = 3). *P < 0.05, **P < 0.01 indicate significant differences between the exposure group and the control. #P < 0.05, ##P < 0.01 indicates the significant differences between BPA and BPA + PS-MPs treatment group. |
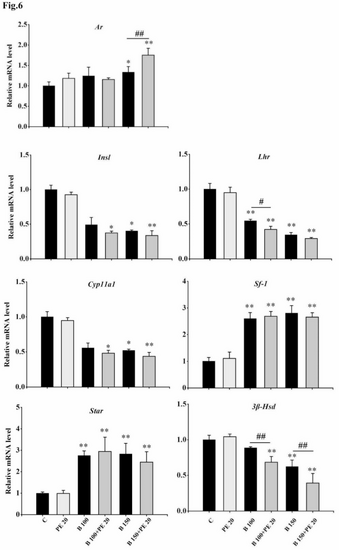
Effects of BPA and PE-MPs on steroidogenic related gene transcription levels in MLTC-1 cells. Note: Results are expressed as mean ± standard deviation (n = 3). *P < 0.05, **P < 0.01 indicate significant differences between the exposure group and the control. #P < 0.05, ##P < 0.01 indicates the significant differences between BPA and BPA + PE-MPs treatment group. |
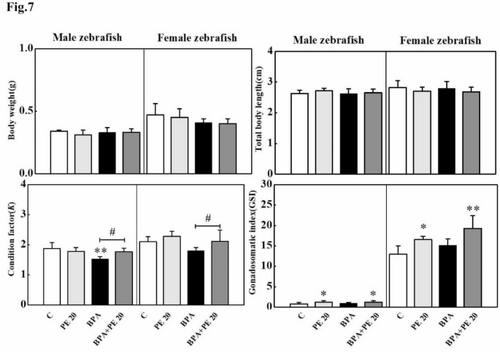
Effects of BPA and PE-MPs on the growth and development parameters and organ index of adult zebrafish. Note: Results are expressed as mean ± standard deviation (n = 3). *P < 0.05, **P < 0.01 indicate significant differences between the exposure group and the control. #P < 0.05, ##P < 0.01 indicates the significant differences between PE-MPs or BPA and BPA + PE-MPs treatment group. |
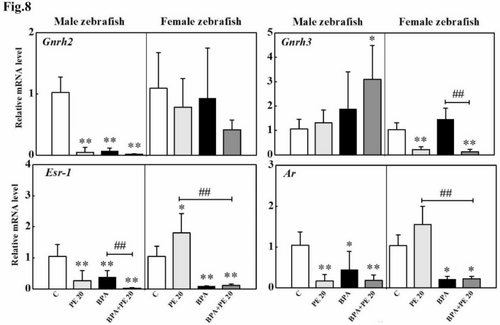
Effects of BPA and PE-MPs on hypothalamic and pituitary hormones, receptor signaling pathways related gene transcription levels in adult zebrafish. Note: Results are expressed as mean ± standard deviation (n = 3). *P < 0.05, **P < 0.01 indicate significant differences between the exposure group and the control. #P < 0.05, ##P < 0.01 indicates the significant differences between PE-MPs or BPA and BPA + PE-MPs treatment group. |
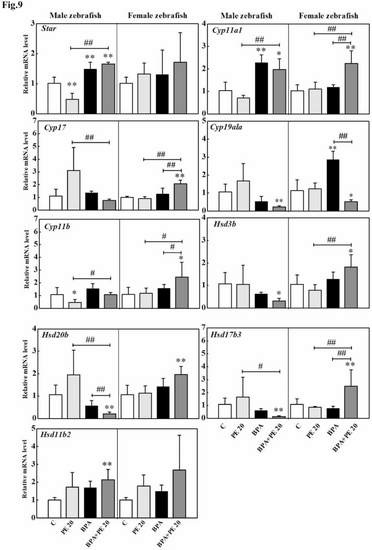
Effects of BPA and PE-MPs on steroidogenic pathways related gene transcription levels in adult zebrafish. Note: Results are expressed as mean ± standard deviation (n = 3). *P < 0.05, **P < 0.01 indicate significant differences between the exposure group and the control. #P < 0.05, ##P < 0.01 indicates the significant differences between PE-MPs or BPA and BPA + PE-MPs treatment group. |