
FIGURE
Fig. 1
Fig. 1
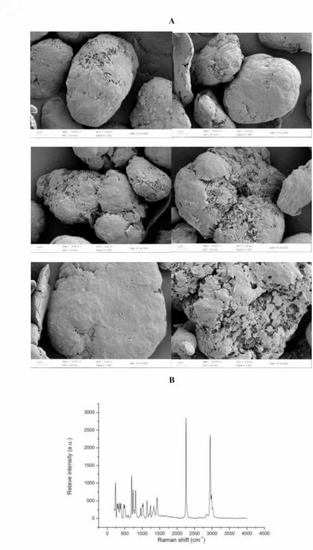
Composition and morphology characterization of the microplastics. Note: (A): Microscopic morphology of the surface of PE-MPs using a scanning electron microscope, Magnification: 10.00 KX; (B): The composition of the PE-MPs using a microscopic raman spectrometer. |
Expression Data
Expression Detail
Antibody Labeling
Phenotype Data
Phenotype Detail
Acknowledgments
This image is the copyrighted work of the attributed author or publisher, and
ZFIN has permission only to display this image to its users.
Additional permissions should be obtained from the applicable author or publisher of the image.
Full text @ Sci. Rep.