
Image
|
Figure Caption
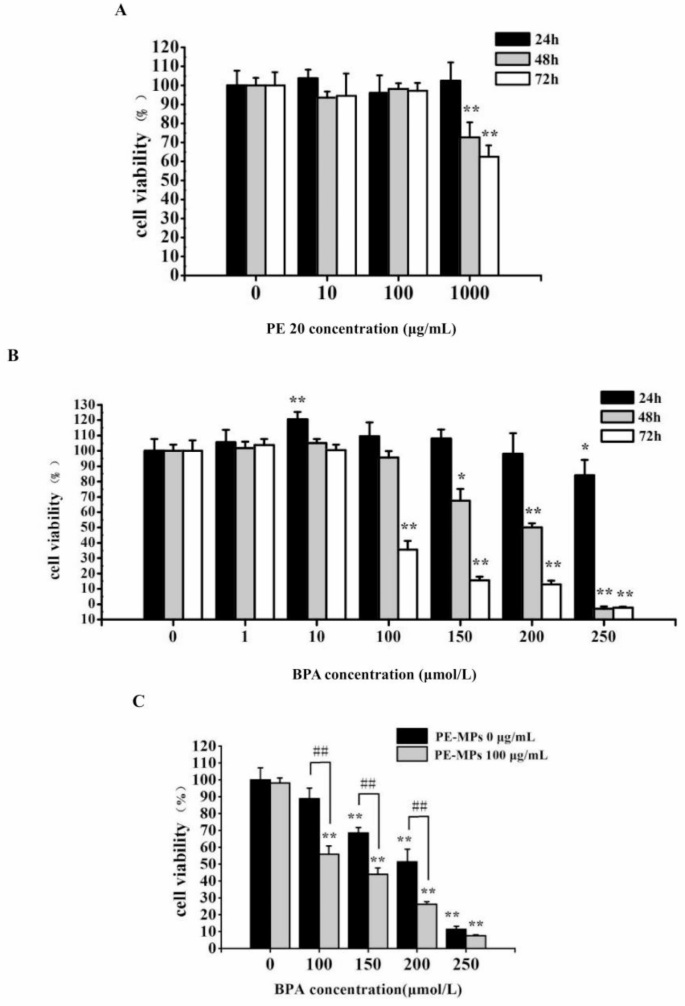
Fig. 2 Effects of BPA and PE-MPs on the cell viablility of MLTC-1 cells. Note: (A): Effects of PE-MPs on the cell viablility of MLTC-1 cells; (B): Effects of BPA on the cell viablility of MLTC-1 cells; (C): Effects of BPA and PE-MPs on the cell viablility of MLTC-1 cells; Results are expressed as mean ± standard deviation (n = 3). *P < 0.05, **P < 0.01 indicate significant differences between the exposure group and the control. #P < 0.05, ##P < 0.01 indicates the significant differences between BPA and BPA + PE-MPs treatment group.
Acknowledgments
This image is the copyrighted work of the attributed author or publisher, and
ZFIN has permission only to display this image to its users.
Additional permissions should be obtained from the applicable author or publisher of the image.
Full text @ Sci. Rep.