
- Title
-
Risk taking behaviour predicts consistent and heritable coping styles in zebrafish
- Authors
- Koets, L., van der Kwaak, T., Schaaf, M., Tudorache, C.
- Source
- Full text @ BMC Neurosci.
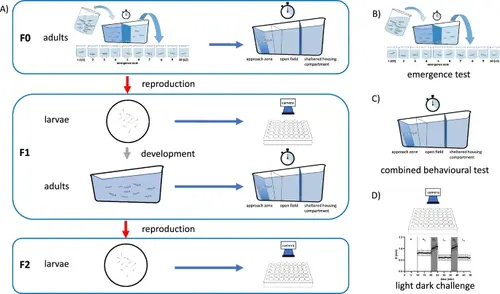
Experimental set up. A The test sequence comprises group and single emergence tests and subsequent open field test and mirror image stimulation for adults of the F0 (parental) generation (“Group emergence test” and “Single emergence test” in “Methods”). After subsequent reproduction per emergence rank (“Method of reproduction” section), F1 were subjected to a light dark challenge as larvae and to an open field test and mirror image stimulation as adults (“Open field test combined with a mirror image stimulation” section). After another round of reproduction per emergence rank, F2 larvae were subjected to a light dark challenge (“Larval behavioural testing: light dark challenge assay” section). B The emergence test assesses the individual tendency of risk taking, by measuring the rank of individuals from a group of fish (group emergence test) or the time of an individual fish (single emergence test) to emerge from a darkened holding compartment into an uncovered and potentially dangerous novel area, compartment. C The open field test combined with a mirror image stimulation was designed to establish a behavioural syndrome of correlated traits. The fish enters from a holding compartment into an open field. After crossing this potentially dangerous novel environment it encounters a mirror image stimulation. The parameters measured were related to locomotion behaviour and aggressiveness. D During the light dark challenge (LDC) test, larval fish are subjected to a series of alternating dark and light periods, during which they exhibit hyperactivity and hypoactivity, respectively. This behaviour is thought to be an anxiety like response to suddenly changing light conditions |
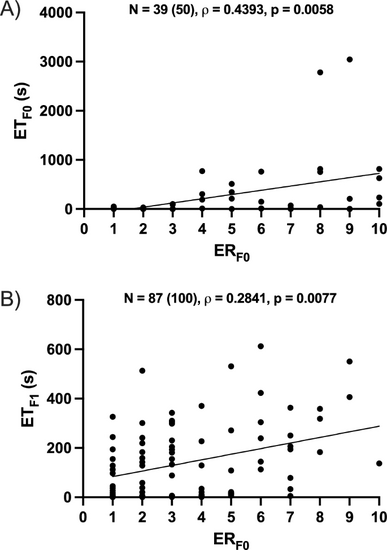
Group and single emergence test in parental (F0) and F1 adults. A Single emergence time plotted against group emergence ranks of the F0 parental fish during an emergence test. Data were collected from 5 batches of 10 adult zebrafish (N = 50, individuals not emerging within 10 min were omitted from analysis) obtained during a group emergence test (rank) and subsequent single emergence test (time), with a significant correlation between emergence rank in the group test and time in the single test (Spearman rank test, N = after (before outlier elimination); simple linear regression: y = 86.18x − 135.3, r2 = 0.14). B Emergence time obtained during a single emergence test of the F1 adults plotted against emergence rank of F0 parental fish during an (N = 100, individuals not emerging within 10 min were omitted from analysis) in the F0 group emergence test (rank) and F1 single emergence test (time), with a significant correlation between rank and time in the single test (Spearman rank test, N = after (before outlier elimination); simple linear regression: y = 22.73x + 60.69, r2 = 0.12). These results establish risk taking as a consistent and heritable behavioural trait |
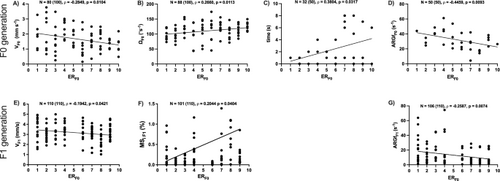
F0 emergence rank as a predictor for adult behaviour. Behavioural parameters obtained during an open field test combined with mirror image stimulation, in adult fish of the F0 parental generation (A–D) and the F1 generation (E–G), plotted over the emergence ranks of the F0 parental fish during a group emergence test: swimming velocity (V; 3A, simple linear regression: Y = − 0.10x + 2.17, r2 = 0.12, and 3E, Y = − 0.06x + 3.51, r2 = 0.04), angular velocity (Ω; 3B, Y = 2.414x + 97.16, r2 = 0.07), state of immobility (MSi; 3F, Y = 0.09x − 0.01, r2 = 0.07), time to approach the mirror (3C, Y = 0.53x + 0.28, r2 = 0.021), and frequency of aggressive behaviour (AGRf, 3D, Y = − 2.12x + 43.81, r2 = 0.18 and 3G, Y = − 1.30x + 19.61, r2 = 0.07). These parameters yielded a significant correlation with the F0 emergence ranks [Spearman rank test, N = after (before outlier elimination)] |

F0 emergence rank as a predictor for larval behaviour. Behavioural parameters obtained during a Light Dark Challenge (LDC) test, in larval (5dpf) fish of the F1 (A–H) and F2 (I, J) generation during the baseline phase (A–D), the dark phases (pooled; E–H) and light and dark phases (pooled; I, J), plotted over the emergence ranks of the F0 parental fish during a group emergence test: swimming velocity (V; 4A, y = − 0.08x + 3.65, r2 = 0.06, 3E, y = − 0.07x + 4.52, r2 = 0.05), acceleration (4B, y = − 0.004x + 0.11, r2 = 0.04, 4F, y = − 0.004x + 0.14, r2 = 0.02), angular velocity (Ω; 3C, y = 1.05x + 69.29, r2 = 0.05, 3G, y = 1.39x + 19.60, r2 = 0.04, 3I, Y = 1.081*X + 57.13, r2 = 0.05), and state of immobility (MSi; 3D, y = 0.13x + 21.25, r2 = 0.08, 3H, y = 0.04y + 9.92, r2 = 0.08, 3 J, Y = 0.02x + 10.01, r2 = 0.02). These parameters yielded a significant correlation with the F0 emergence ranks [Spearman rank test, N = after (before outlier elimination)] |

Consistency of behavioural parameters between larval and adult stage. F1 behavioural parameters obtained during an open field test combined with mirror image stimulation in adult fish are plotted as mean values per emergence ranks of the F0 (group emergence test) over mean values of parameters obtained during the Light Dark Challenge (LDC) test in larval (5dpf) fish of the same generation: swimming velocity (V; 4A, simple linear regression: y = 0.68x + 0.14, r2 = 0.60), angular velocity (Ω; 4B, y = 0.63x + 7.52, r2 = 0,64), and state of immobility (MSi; 4C, y = 0.48x + 23.00, r2 = 0.70) yielded a significant correlation (Spearman rank test) |
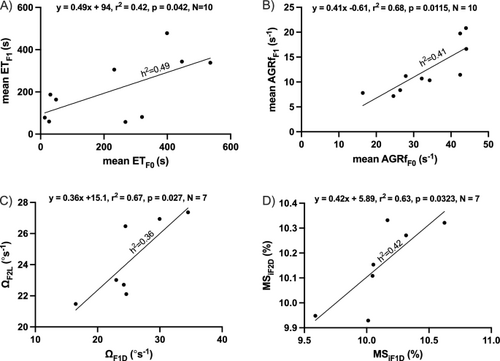
Heritability of behavioural parameters. F1 plotted over F0 (A, B) and F2 plotted over F1 behavioural parameters (C, D), as mean values per emergence ranks of the F0 (group emergence test). A Emergence time (ET) obtained during a single emergence test of the F1 adults plotted over the ET of the F0 parental fish. B Aggressive behaviour frequency (AGRf) obtained during an open field test combined with mirror image stimulation of the F1 adults plotted over the AGRf of the F0 parental fish. C Angular velocity (Ω) of the light phase obtained during a Light Dark Challenge test of the F2 larvae (5dpf) plotted over the Ω of the dark phase of the F1 larvae. D Immobility state (MSi) obtained during the dark phase of a Light Dark Challenge test of the F2 larvae (5dpf) plotted over the MSi of the F1 larvae. These parameters yielded a significant correlation (Spearman rank test; h2 = heritability) |