
- Title
-
Gene Set Enrichment Analysis in Zebrafish Embryos Is Susceptible to False-Positive Results in the Absence of Differentially Expressed Genes
- Authors
- Stead, J.D., Lee, H., Williams, A., Ramírez, S.A.C., Atlas, E., Mennigen, J.A., O'Brien, J.M., Yauk, C.
- Source
- Full text @ Bioinform. Biol. Insights
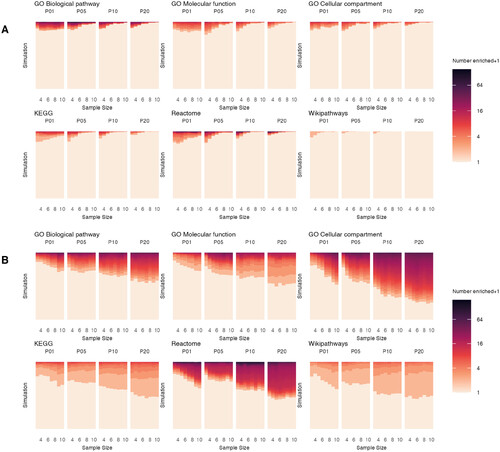
Figure 1. Distribution of the number of significantly enriched gene sets per simulation for ORA and GSEA. ORA (A) and GSEA (B) were run on the results of DEG analysis for each of the 1000 simulations for every combination of pool size (pools of P01, P05, P10 and P20 embryos) and sample size (n = 3 to n = 10). The number of significantly enriched terms for each of the 1000 simulations is indicated by colour (with + 1 added to accommodate the log2 scale). |
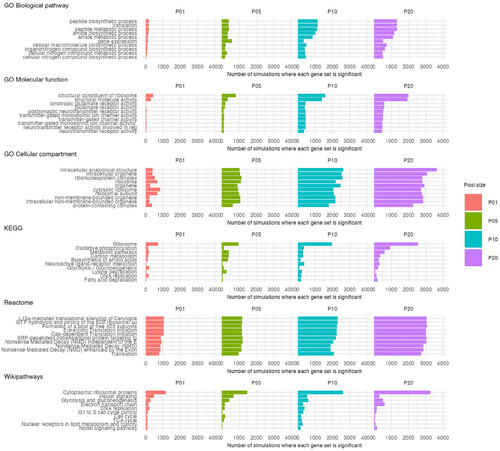
Figure 2. Most common significantly enriched gene sets from GSEA. The 10 most frequently enriched gene sets collated across all 32000 iterations of GSEA are shown for each database, separated by pool size. Names of gene sets with long names have been truncated. |
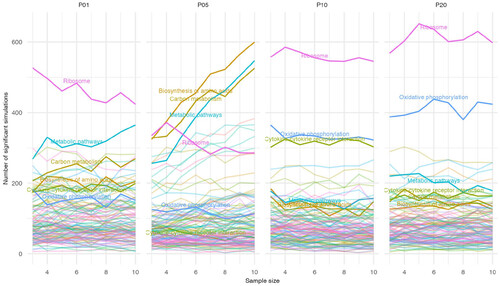
Figure 3. Gene sets with significant deviations from a 1:1 ratio of upregulated to downregulated genes. For each gene set from the KEGG database, the number of upregulated and downregulated genes were tested for significant deviation from a 1:1 ratio using a Chi-square test. Across the 1000 simulations for each combination of pool and sample size, the total number of simulations with a significant Chi-square result was counted for each gene set and plotted. Six gene sets highlighted in the text are emphasized and labelled. |
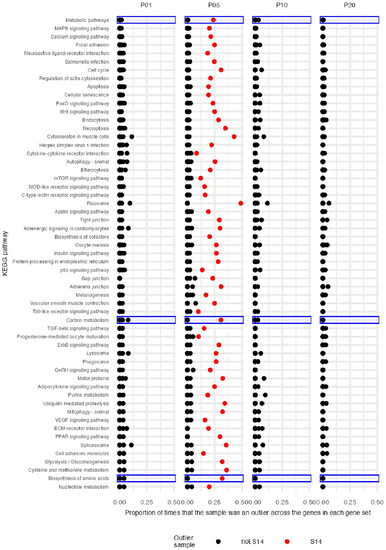
Figure 4. Proportion of genes within each KEGG gene set for which each sample was classed as an outlier. Each spot on the plot represents 1 sample. The y-axis describes which gene set is being analysed. For each sample, the proportion of genes for which the sample was considered an outlier is shown (x-axis). An outlier is defined as a sample for which the expression of a given gene is more than 3 standard deviations from the mean of the pool for that gene (measured as log2 counts per million). For example, if there are 10 genes in a gene set, and the sample had 2 genes that deviated from the pool mean by >3 standard deviations, the proportion shown would be 0.2. Note that most points overlap with proportions at or near 0. One sample (S14) was an outlier for an unusually large proportion of genes in many gene sets. All data from this sample are shown in red. Three gene sets for P05 showed a particularly prominent sample-size-dependent deviation from an expected 1:1 ratio of up to downregulation of genes (see Figure 3), and are highlighted by blue boxes. Results are only shown for gene sets with >25 genes represented on the TempO-Seq array, with the gene sets containing the most genes shown at the top. |

Figure 5. Gene sets with significant deviation from a 1:1 ratio of upregulated to downregulated genes in P05 samples, with and without inclusion of sample S14. Analyses described in Figure 3 are here repeated for new DEG simulations using P05 samples only, either including or excluding sample S14, identified as an outlier in the expression of many genes. |
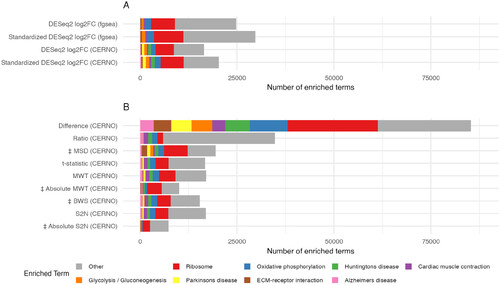
Figure 6. Impact of GSEA algorithm and ranking statistic on the total number of significantly enriched gene sets. The total number of significantly enriched gene sets combined across all 32000 simulations is shown for 13 different combinations of GSEA algorithm and ranking statistic. The 8 gene sets detected with the highest frequency across all 13 analyses are colorized with all other gene sets combined into the category ‘Other’. |