
Fig. 4
- ID
- ZDB-FIG-250409-88
- Publication
- Stead et al., 2025 - Gene Set Enrichment Analysis in Zebrafish Embryos Is Susceptible to False-Positive Results in the Absence of Differentially Expressed Genes
- Other Figures
- All Figure Page
- Back to All Figure Page
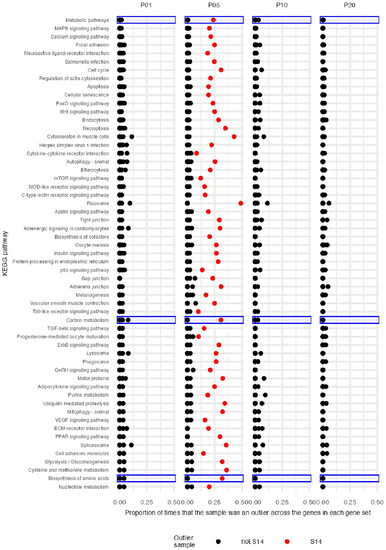
Figure 4. Proportion of genes within each KEGG gene set for which each sample was classed as an outlier. Each spot on the plot represents 1 sample. The y-axis describes which gene set is being analysed. For each sample, the proportion of genes for which the sample was considered an outlier is shown (x-axis). An outlier is defined as a sample for which the expression of a given gene is more than 3 standard deviations from the mean of the pool for that gene (measured as log2 counts per million). For example, if there are 10 genes in a gene set, and the sample had 2 genes that deviated from the pool mean by >3 standard deviations, the proportion shown would be 0.2. Note that most points overlap with proportions at or near 0. One sample (S14) was an outlier for an unusually large proportion of genes in many gene sets. All data from this sample are shown in red. Three gene sets for P05 showed a particularly prominent sample-size-dependent deviation from an expected 1:1 ratio of up to downregulation of genes (see Figure 3), and are highlighted by blue boxes. Results are only shown for gene sets with >25 genes represented on the TempO-Seq array, with the gene sets containing the most genes shown at the top. |