
Image
|
Figure Caption
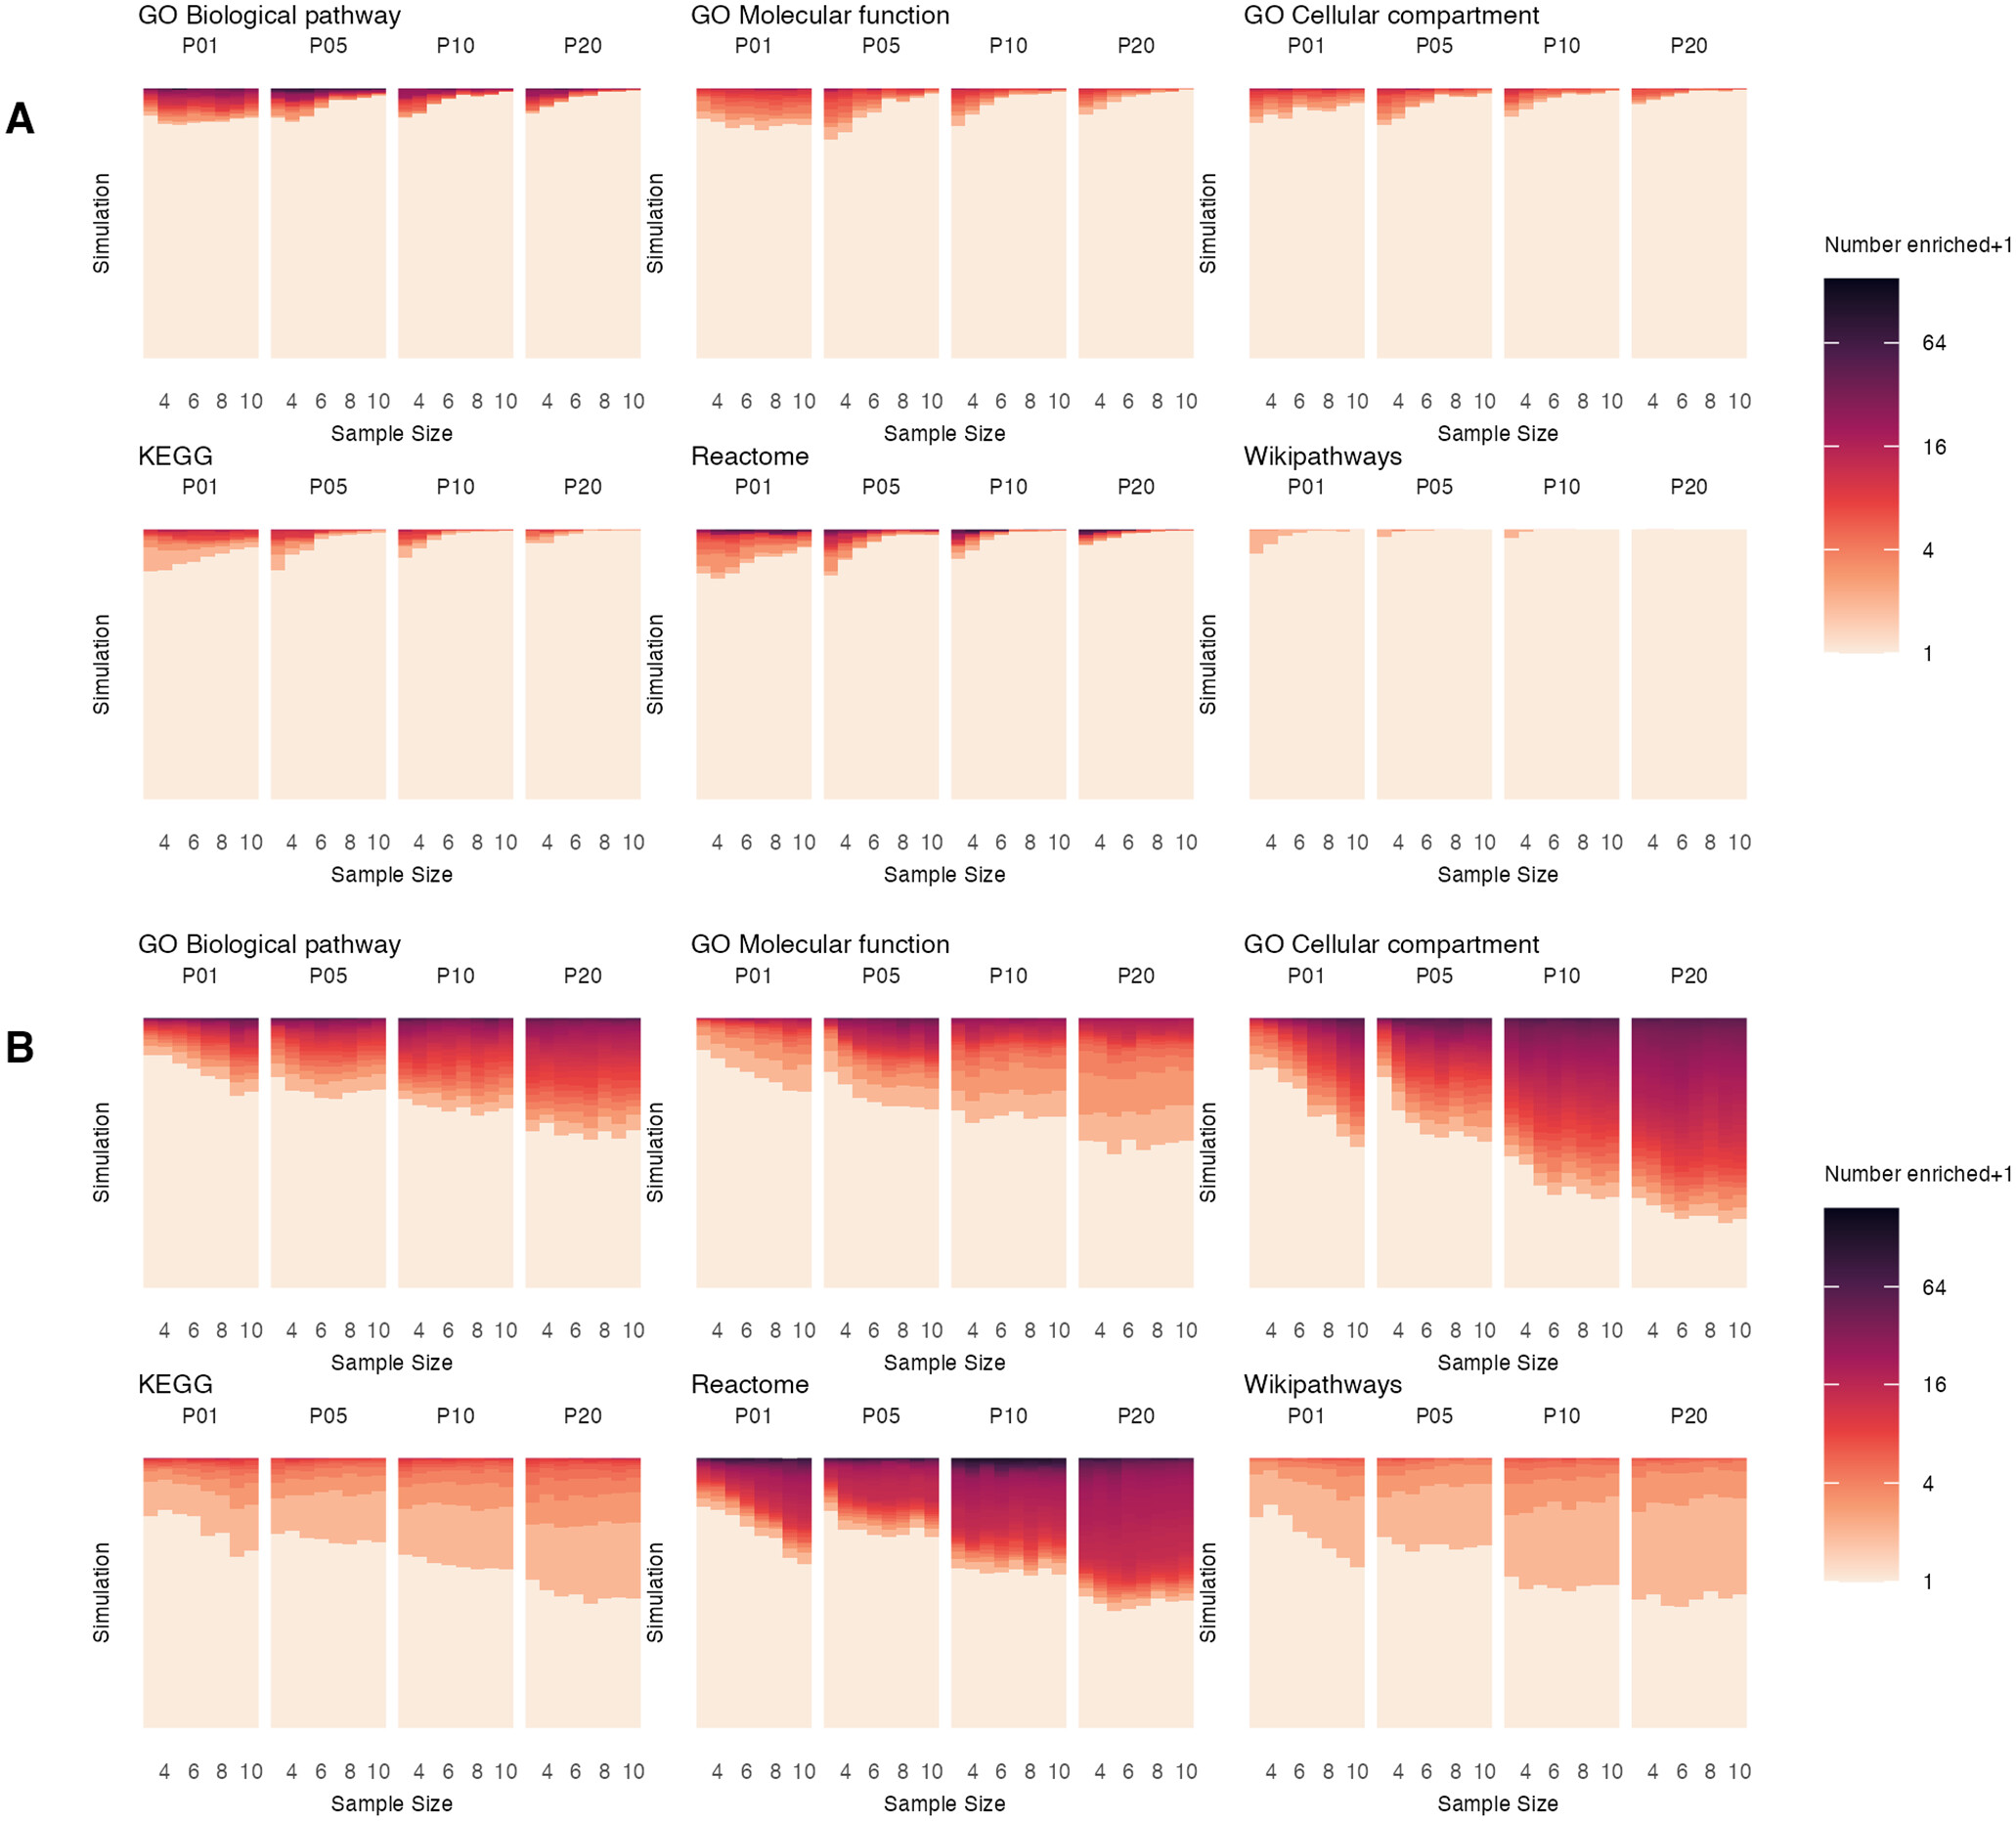
Fig. 1 Figure 1. Distribution of the number of significantly enriched gene sets per simulation for ORA and GSEA. ORA (A) and GSEA (B) were run on the results of DEG analysis for each of the 1000 simulations for every combination of pool size (pools of P01, P05, P10 and P20 embryos) and sample size (n = 3 to n = 10). The number of significantly enriched terms for each of the 1000 simulations is indicated by colour (with + 1 added to accommodate the log2 scale).
Acknowledgments
This image is the copyrighted work of the attributed author or publisher, and
ZFIN has permission only to display this image to its users.
Additional permissions should be obtained from the applicable author or publisher of the image.
Full text @ Bioinform. Biol. Insights