
- Title
-
Effects of protein-rich multi-nutrient intervention on bone mineralization and development: insights from a randomized controlled trial in prepubertal children and a zebrafish experiment
- Authors
- Xing, X., Li, X., Guo, Y., Gu, W., Liu, Q., Ma, J., Su, L., Wang, Y., Zhao, Y., Wang, S.
- Source
- Full text @ Food Funct
The protein-rich multi-nutritional drink used in this study contained 15.0 g of proteins (13.0 g of MPC and WPH, and 2.0 g of CP) per 235 ml. This drink also contained multiple ingredients providing fat, carbohydrate, dietary fiber, taurine, and 17 types of vitamins and minerals. All nutrients listed in ESI Table 1? occur naturally within the product, with no alterations or additions made by the researchers. |
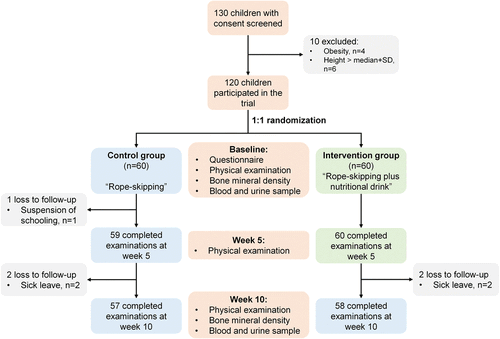
Left forearm BMD and BMC of children measured by DXA. Panel A and D: Violin plots for BMD and BMC in both groups measured at the baseline and week 10; the difference between the two groups was compared by the Wilcoxon test. Panel B and E: Bar plots for the absolute changes in BMD and BMC during the intervention and the intervention effect analyzed by the linear mixed-effects model. Panel C and F, Bar plots for the percentage changes in BMD and BMC during the intervention and the intervention effect analyzed using the general linear regression model. For BMC analysis, the bone area was adjusted. * P < 0.05; ** P < 0.01; *** P < 0.001; NS, not significant; error bars show 95% confidence intervals. BMD, bone mineral density; BMC, bone mineral content. |
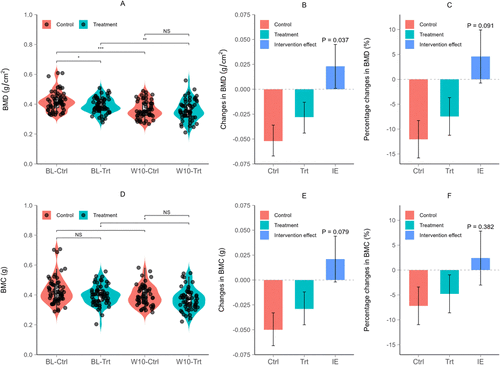
Serum bone metabolism biomarkers at the baseline and week 10. Panel A, C, E, G, and I: Violin plots for bone metabolism biomarkers in each group measured at the baseline and week 10; the difference between the two groups was compared by the Wilcoxon test. Panel B, D, F, H, and J: Bar plots for the changes in bone metabolism biomarkers during the intervention and the intervention effect analyzed by the mixed-effects model. * P < 0.05; ** P < 0.01; *** P < 0.001; NS, not significant; error bars show 95% confidence intervals. 25(OH)D3, 25-hydroxyvitamin D3; PTH, parathyroid hormone; IGF-1, insulin-like growth factor 1; ln, natural logarithm. |
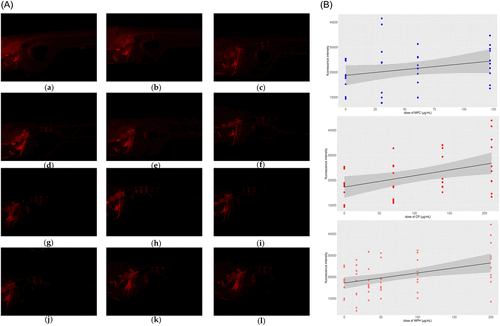
Fluorescence images of zebrafish backbones at different doses of the three reagents. Panel A: Representative fluorescence images of the backbones in each group. (a) Blank control. (b) Positive control; (c to e) MPC at 30.5, 61, and 122 ?g mL?1; (f to h) CP at 70, 140, and 210 ?g mL?1; (i to l) WPH at 33, 50, 100 and 200 ?g mL?1. Panel B: Linear regression plots between concentrations of MPC, CP, and WPH and fluorescence intensity of the backbones. MPC, milk protein concentrates; CP, collagen peptides; WPH, whey protein hydrolysates. |