Image
Figure Caption
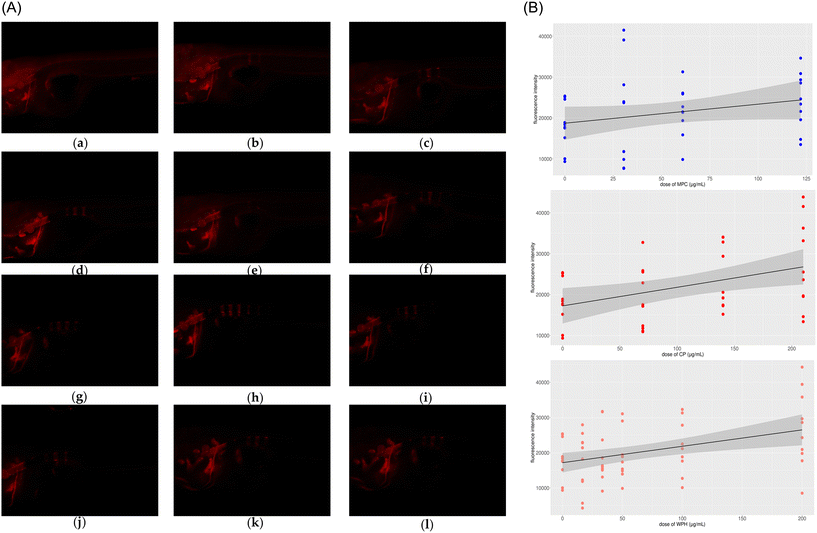
Fig. 4 Fluorescence images of zebrafish backbones at different doses of the three reagents. Panel A: Representative fluorescence images of the backbones in each group. (a) Blank control. (b) Positive control; (c to e) MPC at 30.5, 61, and 122 μg mL−1; (f to h) CP at 70, 140, and 210 μg mL−1; (i to l) WPH at 33, 50, 100 and 200 μg mL−1. Panel B: Linear regression plots between concentrations of MPC, CP, and WPH and fluorescence intensity of the backbones. MPC, milk protein concentrates; CP, collagen peptides; WPH, whey protein hydrolysates.
Acknowledgments
This image is the copyrighted work of the attributed author or publisher, and
ZFIN has permission only to display this image to its users.
Additional permissions should be obtained from the applicable author or publisher of the image.
Full text @ Food Funct

