FIGURE SUMMARY
Title

A larval zebrafish model of traumatic brain injury: optimizing the dose of neurotrauma for discovery of treatments and aetiology

Authors
Locskai, L.F., Gill, T., Tan, S.A.W., Burton, A.H., Alyenbaawi, H., Burton, E.A., Allison, W.T.
Source
Full text @ Biol. Open

Larval zebrafish model of TBI and the modifiable aspects investigated herein. The larval zebrafish TBI model provides an elegantly simple system to create a blast pressure wave and induce TBI. A weight is dropped onto the plunger of a syringe housing dozens of zebrafish larvae in media. The plunger depresses when struck by the falling weight, and this transduces a pressure wave through the liquid media and thus through the zebrafish larvae. In the present study, we modified the following aspects of the larval zebrafish TBI model to increase the blast pressure wave created and allow the user to administer a variety of injury doses: (A) the mass of the weight that was dropped; (B) the height from which the weight was dropped; (C) the size (volume) of the syringe that housed the group of zebrafish larvae. (D) The rigidity of the syringe mount, where a syringe clamp holder had arm movement which dissipates pressure upon impact versus a foam block syringe holder which halted syringe movement upon weight impact. Parameter changes are colour coded throughout the manuscript to match the numbered colours of this figure.

Maximal pressure created in alternate configurations of the larval zebrafish TBI model. To optimise TBI forces, four equipment parameters were adjusted in concert: (1) a 10 ml or 20 ml syringe was used, and (2) the syringe was held by either a clamp or a rigid foam block. Next, (3) weights of various masses were dropped (4) from various heights (108 cm, 54 cm, 27 cm). Weights ranging from 65-300 g were dropped onto the syringe, and the pressure levels generated for each configuration were measured using Arduino IDE software. Pressure values displayed are the mean values of the maximal pressure reading achieved from three independent weight drop recordings. (A,B) Example time course of pressure dynamics and average pressure generated per pressure wave in the 108 cm/20 ml syringe/foam block TBI setup. These data are duplicated and expanded in Figs. S2-S5 to highlight that additional pressure waves are generated due to the weight bouncing on impact. (C-F) Maximal pressure measurements for each indicated parameter combination. Maximal pressure can be manipulated across three orders of magnitude through changing various TBI assay settings. Alterations to the mass of the weight dropped had the largest impact on maximal pressure, followed by changes to the drop height of the weight. Using a foam block to hold the syringe and decreasing the syringe size both modestly increased maximal pressure.

Seizure-like locomotor activity of 6 dpf larvae following TBI increases at moderate injury levels but decreases at more severe injury levels. Following TBI injury with various parameters, seizure-like activity was assessed by placing the larvae in a 96-well plate recorded using EthovisionXT. Each data point represents an individual zebrafish larva. (A) Exemplar activity traces of individual zebrafish larvae within wells of a 96-well plate. The red depicts the movement pattern of the larvae during one minute of activity and orange boxes denote groups that displayed significantly increased mean activity. (B-D) Mean locomotor activity of larval zebrafish after dropping 100 g (B), 200 g (C), or 300 g (D) from various heights onto a 20 ml syringe held by a clamp compared to a no TBI control. Each experimental group had two to four replicates. Each dot represents behaviour of an individual larva. No TBI control data (N=60) is shared between each graph to prevent bias from splitting the individual control replicates amongst each comparative graph (B) 100 g N=21, 23, 12 for the 27 cm, 54 cm, and 108 cm drop height groups; (C) 200 g N=21, 17, and 12 for the 27 cm, 54 cm, and 108 cm drop height groups; (D) 300 g N=24, 18, and 12 for the 27 cm, 54 cm, and 108 cm drop height groups. (E,F) Linear regression analysis of larval activity as a function of maximal pressure and the average pressure of the primary pressure wave, respectively, for each weight (maximal pressure R2: 0.99 P<0.01 all weights; average pressure of primary pressure wave R2: 0.99 (100 and 200 g) and 0.90 (300 g), P<0.05 (100 g and 200 g). (G) Higher pressure foam block holder induced a decrease in zebrafish locomotor activity after dropping 100 g (N= 48), 200 g (N=48), or 300 g (N=48) from 108 cm onto a 10mL syringe held by a foam block compared to a no TBI control (N=48) (four experimental replicates). (H) Zebrafish locomotor activity as a function of maximal pressure experienced during injury shows a range of 90-300 kPa where behavioural seizures are detected (green) and trend with increased pressure (line), whereas higher pressure induces decreased locomotor activity. A one-way ANOVA with Dunnett's multiple comparisons of means was used to test for statistical significance for behavioural experiments (*=P<0.05, **=P<0.01).

Post-traumatic seizures and unresponsive zebrafish behaviours increase with more severe injury. To assess decreased locomotor activity following higher injury and pressure intensities, seizures and loss of consciousness were measured manually. (A) Zebrafish larvae were recorded after injury using either the foam block or clamp syringe holder. Larvae were manually scored (blinded) for the presence of seizure behaviour using three categories: no seizure, stage I seizure, or stage II/III seizure. The proportion of larvae displaying seizure trended with increased maximal pressure levels (N=48 no TBI, N=24,100 g clamp, N=24,200 g clamp, N=24,300 g clamp, N=24,100 g foam block, N=19,200 g foam block, and N=22,300 g foam block injured larvae. Each experimental group was repeated twice). (B) A threshold of 1 min or more of inactivity was set to quantify larval inactivity after injury in the videos used for manual seizure scoring. The total duration of these inactive bouts was quantified. Inactivity was significantly higher than no TBI controls for the highest pressure clamp injury group (300 g) and all foam block injury groups (P<0.05-0.001). (C) Following TBI larval zebrafish display a stunned phenotype where they do not respond to stimuli in the form of a fin poke, whereas non-injured fish respond vigorously. The proportion of larvae that exhibit this stunned phenotype increased for higher injury intensity groups versus lower injury groups (purple=highest intensity, N=20; blue=middle intensity, N=13; green=lowest intensity, N=11. Each group had two replicates). Across experiments, dead larvae were removed from quantification. Larvae were verified as dead by a lack of heartbeat in the fin poke response assay and zero movements while floating during video recording. A one-way ANOVA with Dunnett's multiple comparisons of means was used to test for statistical significance between injured larva inactivity and no TBI inactivity (*P<0.05, ** P<0.01, ***P<0.001).

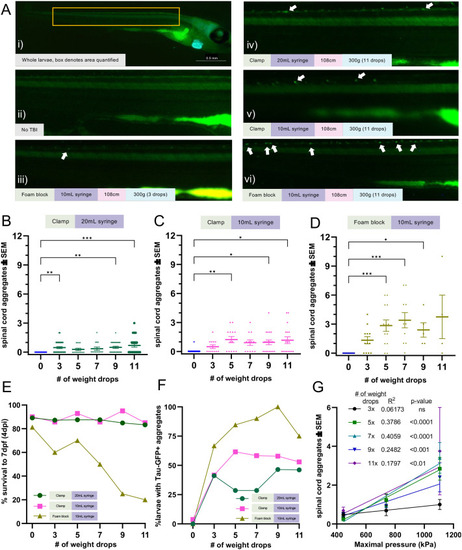
Tau aggregation increases with injury levels. Tau biosensor larvae were used to quantify how increasing injury intensity impacts the amount of detectable tau pathology. These transgenic larvae express full-length human tau and the human tau 4R domain linked to GFP, allowing for the visualization of tau aggregates as GFP+ puncta. Data represents individual larvae and bars represent +/- SEM and each experimental group was replicated at least twice. (A) Representative images of larval zebrafish spines, where quantifiable GFP+ Tau puncta increase as the severity of injury and number of weight drops increase. Image i depicts the full body of a larva for orientation and scale (scale bar: 0.5 mm). White arrows denote GFP+ Tau puncta. (B) Quantification of GFP+ tau aggregates in larvae injured in a 20mL syringe held by a clamp (N=41, 34, 14, 14, 26, and 24 for the 0, 3, 5, 7, 9 and 11 drops respectively). (C) Quantification of GFP+ tau aggregates in larvae injured in a 10mL syringe held by a clamp (N=27, 12, 13, 12, 19, and 18 for the 0, 3, 5, 7, 9 and 11 drops respectively). (D) Quantification of GFP+ tau aggregates in larvae injured in a 10mL syringe held by a foam block (N=13, 12, 13, 10, 5, and 4 for the 0, 3, 5, 7, 9 and 11 drops respectively). (E) Percent of zebrafish larvae that survived to 7 dpf after TBI using each TBI setup (N=equivalent to B-D). (F) Percent of zebrafish larvae with one or more tau GFP+ puncta in each TBI model setup. (G) Linear regression of mean spinal cord tau puncta (data from Fig. 5B-D) as a function of maximal pressure for larval injury groups that received differing numbers of weight drops. Every weight drop group except the three weight drop group significantly trended with maximal pressure. The five and seven weight drop groups had the highest R2.

Acknowledgments
This image is the copyrighted work of the attributed author or publisher, and ZFIN has permission only to display this image to its users. Additional permissions should be obtained from the applicable author or publisher of the image. Full text @ Biol. Open