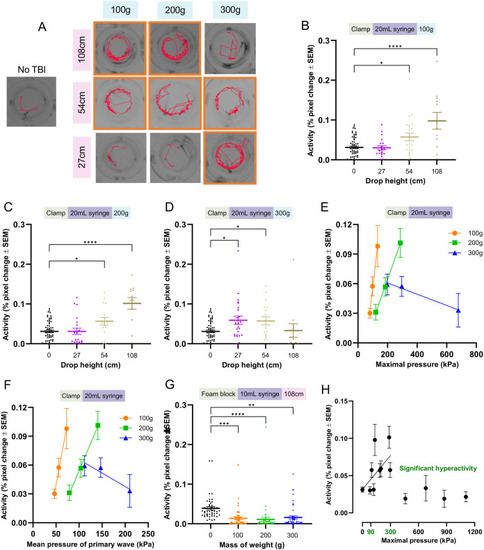
Seizure-like locomotor activity of 6 dpf larvae following TBI increases at moderate injury levels but decreases at more severe injury levels. Following TBI injury with various parameters, seizure-like activity was assessed by placing the larvae in a 96-well plate recorded using EthovisionXT. Each data point represents an individual zebrafish larva. (A) Exemplar activity traces of individual zebrafish larvae within wells of a 96-well plate. The red depicts the movement pattern of the larvae during one minute of activity and orange boxes denote groups that displayed significantly increased mean activity. (B-D) Mean locomotor activity of larval zebrafish after dropping 100 g (B), 200 g (C), or 300 g (D) from various heights onto a 20 ml syringe held by a clamp compared to a no TBI control. Each experimental group had two to four replicates. Each dot represents behaviour of an individual larva. No TBI control data (N=60) is shared between each graph to prevent bias from splitting the individual control replicates amongst each comparative graph (B) 100 g N=21, 23, 12 for the 27 cm, 54 cm, and 108 cm drop height groups; (C) 200 g N=21, 17, and 12 for the 27 cm, 54 cm, and 108 cm drop height groups; (D) 300 g N=24, 18, and 12 for the 27 cm, 54 cm, and 108 cm drop height groups. (E,F) Linear regression analysis of larval activity as a function of maximal pressure and the average pressure of the primary pressure wave, respectively, for each weight (maximal pressure R2: 0.99 P<0.01 all weights; average pressure of primary pressure wave R2: 0.99 (100 and 200 g) and 0.90 (300 g), P<0.05 (100 g and 200 g). (G) Higher pressure foam block holder induced a decrease in zebrafish locomotor activity after dropping 100 g (N= 48), 200 g (N=48), or 300 g (N=48) from 108 cm onto a 10mL syringe held by a foam block compared to a no TBI control (N=48) (four experimental replicates). (H) Zebrafish locomotor activity as a function of maximal pressure experienced during injury shows a range of 90-300 kPa where behavioural seizures are detected (green) and trend with increased pressure (line), whereas higher pressure induces decreased locomotor activity. A one-way ANOVA with Dunnett's multiple comparisons of means was used to test for statistical significance for behavioural experiments (*=P<0.05, **=P<0.01).
|
