FIGURE SUMMARY
Title

m6A-mRNA Reader YTHDF2 Identified as a Potential Risk Gene in Autism With Disproportionate Megalencephaly

Authors
Nishizaki, S.S., Haghani, N.K., La, G.N., Mariano, N.A.F., Uribe-Salazar, J.M., Kaya, G., Regester, M., Andrews, D.S., Nordahl, C.W., Amaral, D.G., Dennis, M.Y.
Source
Full text @ Autism Res

Macrocephaly level of candidate ASD‐DM and ASD‐M genes. (A) A histogram representing the number of SSC probands v. head circumference percentiles shows a skew toward larger head‐sizes compared to age‐ and sex‐matched typically developing children. The red bar designates those meeting the criteria for macrocephaly. The dashed line represents the distribution mean. (B) ASD‐DM and ASD‐M genes listed by their identified proband's head circumference percentiles show genes previously associated with ASD‐DM (first gray quadrant) are more likely to be associated with a higher head circumference percentiles than genes previously associated with autism (second white quadrant) and DM (third gray quadrant) alone. Color represents the macrocephaly type. DMac, disproportionate macrocephaly; RM, relative macrocephaly; SO, somatic overgrowth.

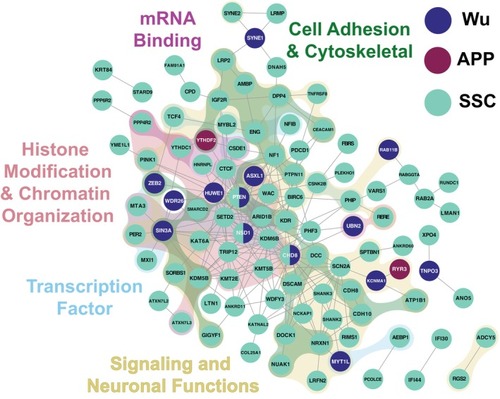
Network analysis and gene ontology (GO) of ASD‐DM candidate genes. ASD‐DM candidate genes from SSC (teal), APP (purple), and Wu (navy) probands are connected in a network via active interactions as determined by STRING (Szklarczyk et al. 2015). Background colors represent shared GO molecular functions. Disconnected gene nodes are not included.

Disrupting ythdf2 in zebrafish is associated with head and brain size phenotypes. (A) Copy‐number‐estimate plot (QuickMer2) using sequencing data from the APP proband harboring a de novo 109‐kb duplication on chromosome 1 compared with their parents harboring two diploid copies. (B) IGV plot showing discordant reads in the APP proband supporting a tandem duplication. (C) An illustration of the tandem duplication on chromosome 1 in an APP proband encompassing GMEB1 and all but the last exon of YTHDF2. (D) Cartoon depicting the CRISPR‐based knockdown (KD) and overexpression using in vitro transcribed mRNAs (mRNA) experimental paradigms by injection of nucleic acid into single‐cell zebrafish embryos. (E) Morphometric measurements were produced using VAST platform images and automated feature extraction via FishInspector (Teixidó et al. 2019) of body length, distance between the eyes, telencephalon width, and head‐trunk angle. (F) Features were quantified in 3 dpf larvae by comparing ythdf2 knockdown (KD, n = 37) versus scrambled gRNA controls (Cont., n = 34) and YTHDF2 overexpression (mRNA, n = 55) versus injection controls (Cont., n = 55) (top). Similar comparisons were made for gmeb1 KD (n = 33) versus scrambled gRNA controls (n = 34) and GMEB1 mRNA (n = 26) vs. injection controls (n = 26) (bottom). (G) Knockdown and mRNA injected zebrafish harboring a pan neuronal marker (HuC:eGFP) reveal brain size differences at 3 dpf. Representative control, knockdown, and mRNA injected zebrafish images of transgenic larvae. Scale bar is 100 μm. (H) ythdf2 knockdown embryos show significantly decreased midbrain volume (Wilcoxon t test, p value = 0.006). YTHDF2 mRNA‐injected embryos show both significantly increased midbrain (Wilcoxon t test, p value = 0.014) and forebrain (Wilcoxon t test, p value = 0.001). All p values are adjusted for multiple‐testing using Bonferroni correction and only significant comparisons depicted as: ≤ 0.05*, ≤ 0.01**, ≤ 0.001***.

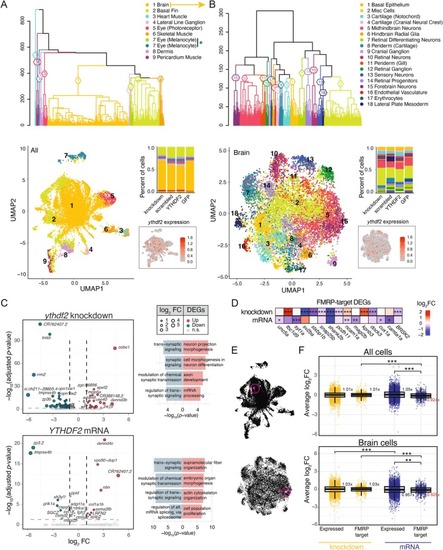
Single‐cell transcriptomes of YTHDF2 zebrafish models. (A) Hierarchical clustering of 19,141 cells across ythdf2 knockdown crispant and YTHDF2 mRNA overexpression models and associated controls (scramble gRNA and eGFP mRNA) into broad cell types based on the expression of gene markers. Dendrograms were created to cluster cells with similar expression profiles and visualized via UMAP plots, with colors indicating assigned cluster IDs. The proportion of cells assigned to each cluster per model is a percentage of total cells indicated as a barplot. Cells with ythdf2 transcripts are colored red based on a continuous scale of natural log normalized expression (Hao et al. 2024). (B) Hierarchical sub‐clustering of 12,066 brain cells across all conditions into 18 cell types based on the expression of gene markers. Proportion of cells and ythdf2 expression are also plotted, as described in (A) for the brain sub cluster. (C) Volcano plots showing DEGs across all cell‐types within ythdf2 knockdown (top) and YTHDF2 mRNA overexpression (bottom) models relative to controls, with fold change (FC) plotted versus adjusted p value. DEGs with absolute log2FC ≥ 1 and adjusted p value ≤ 0.05 are colored (upregulated as red, downregulated as blue). A subset of significantly enriched gene ontologies (adjusted p value ≤ 0.01) are depicted as bar plots for upregulated and downregulated DEGs next to each respective volcano plot for knockdown and overexpression models. (D) Average log2FC for 15 significant FMRP‐target DEGs identified in knockdown or overexpression models with respect to controls are shown. (E) Joint kernel density estimation was calculated from all 15 FMRP‐target DEGs (Nebulosa) highlighting higher expression within a sub‐type of brain cells. (F) The average log2FC per expressed gene (0.01% of cells) was plotted across all cells and brain cells (see Section 2) for all and 675 FMRP‐target genes expressed in both groups for the ythdf2 knockdown and YTHDF2 mRNA zebrafish models. Comparisons were made using t tests either paired (between models) or unpaired (within models). Median fold changes versus respective controls (scrambled for knockdown and eGFP for mRNA) are indicated next to plots. All p values in this figure are represented as: ≤ 0.05*, ≤ 0.01**, < 0.001***.

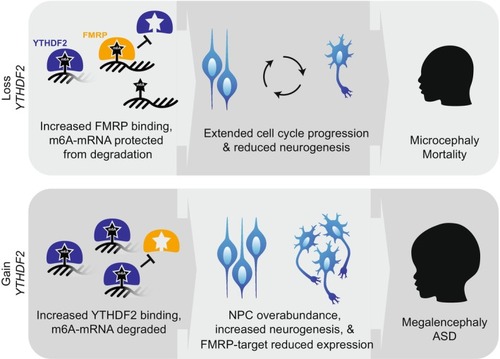
A potential role for YTHDF2 in ASD‐DM. Proposed model of YTHDF2 loss‐ or gain‐of‐function phenotypes, with respect to FXS protein FMRP. We hypothesize YTHDF2 loss‐of‐function would lead to microcephaly due to increased FMRP binding and lack of m6‐mRNA degradation, extended cell cycle progression, and reduced neurogenesis. As the gene is highly conserved and knockout models are embryonic lethal, likely loss‐of‐function mutations in humans lead to disease pathogenicity or are incompatible with life. Inversely, YTHDF2 duplication would lead to megalencephaly following increased m6A‐mRNA degradation as YTHDF2 outcompetes FMRP, neural progenitor cell (NPC) overabundance, and increased neurogenesis.

Acknowledgments
This image is the copyrighted work of the attributed author or publisher, and ZFIN has permission only to display this image to its users. Additional permissions should be obtained from the applicable author or publisher of the image. Full text @ Autism Res