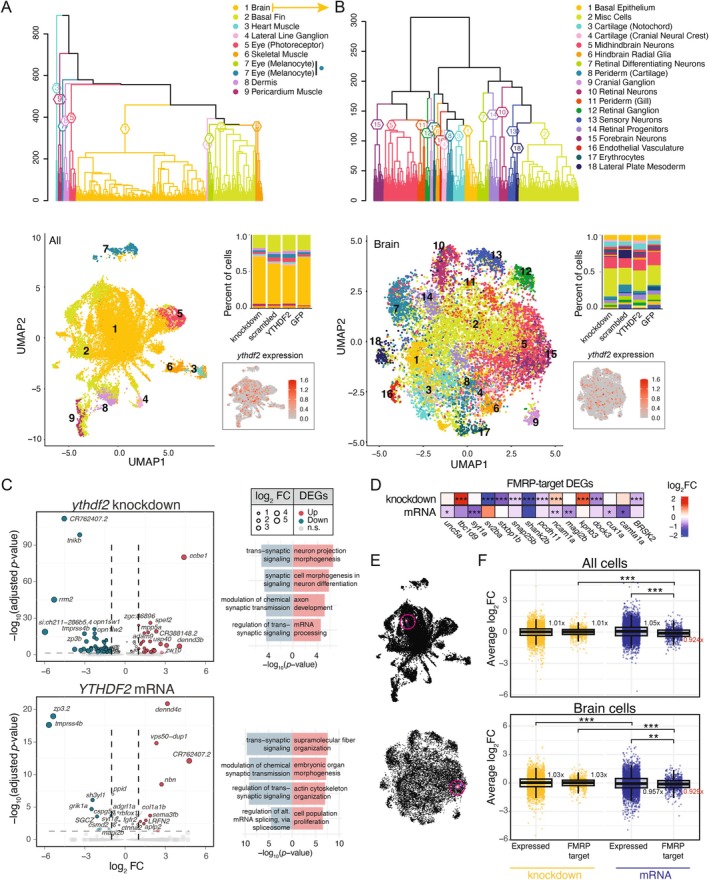
IMAGE

FIGURE 4

ID
ZDB-IMAGE-250602-103
Source
Figures for Nishizaki et al., 2025
Image
Figure Caption

FIGURE 4

Single‐cell transcriptomes of YTHDF2 zebrafish models. (A) Hierarchical clustering of 19,141 cells across ythdf2 knockdown crispant and YTHDF2 mRNA overexpression models and associated controls (scramble gRNA and eGFP mRNA) into broad cell types based on the expression of gene markers. Dendrograms were created to cluster cells with similar expression profiles and visualized via UMAP plots, with colors indicating assigned cluster IDs. The proportion of cells assigned to each cluster per model is a percentage of total cells indicated as a barplot. Cells with ythdf2 transcripts are colored red based on a continuous scale of natural log normalized expression (Hao et al. 2024). (B) Hierarchical sub‐clustering of 12,066 brain cells across all conditions into 18 cell types based on the expression of gene markers. Proportion of cells and ythdf2 expression are also plotted, as described in (A) for the brain sub cluster. (C) Volcano plots showing DEGs across all cell‐types within ythdf2 knockdown (top) and YTHDF2 mRNA overexpression (bottom) models relative to controls, with fold change (FC) plotted versus adjusted p value. DEGs with absolute log2FC ≥ 1 and adjusted p value ≤ 0.05 are colored (upregulated as red, downregulated as blue). A subset of significantly enriched gene ontologies (adjusted p value ≤ 0.01) are depicted as bar plots for upregulated and downregulated DEGs next to each respective volcano plot for knockdown and overexpression models. (D) Average log2FC for 15 significant FMRP‐target DEGs identified in knockdown or overexpression models with respect to controls are shown. (E) Joint kernel density estimation was calculated from all 15 FMRP‐target DEGs (Nebulosa) highlighting higher expression within a sub‐type of brain cells. (F) The average log2FC per expressed gene (0.01% of cells) was plotted across all cells and brain cells (see Section 2) for all and 675 FMRP‐target genes expressed in both groups for the ythdf2 knockdown and YTHDF2 mRNA zebrafish models. Comparisons were made using t tests either paired (between models) or unpaired (within models). Median fold changes versus respective controls (scrambled for knockdown and eGFP for mRNA) are indicated next to plots. All p values in this figure are represented as: ≤ 0.05*, ≤ 0.01**, < 0.001***.

Acknowledgments
This image is the copyrighted work of the attributed author or publisher, and ZFIN has permission only to display this image to its users. Additional permissions should be obtained from the applicable author or publisher of the image. Full text @ Autism Res