
FIGURE 1
- ID
- ZDB-IMAGE-250602-99
- Publication
- Nishizaki et al., 2025 - m6A-mRNA Reader YTHDF2 Identified as a Potential Risk Gene in Autism With Disproportionate Megalencephaly
- All Figures
- Figures for Nishizaki et al., 2025
|
FIGURE 1
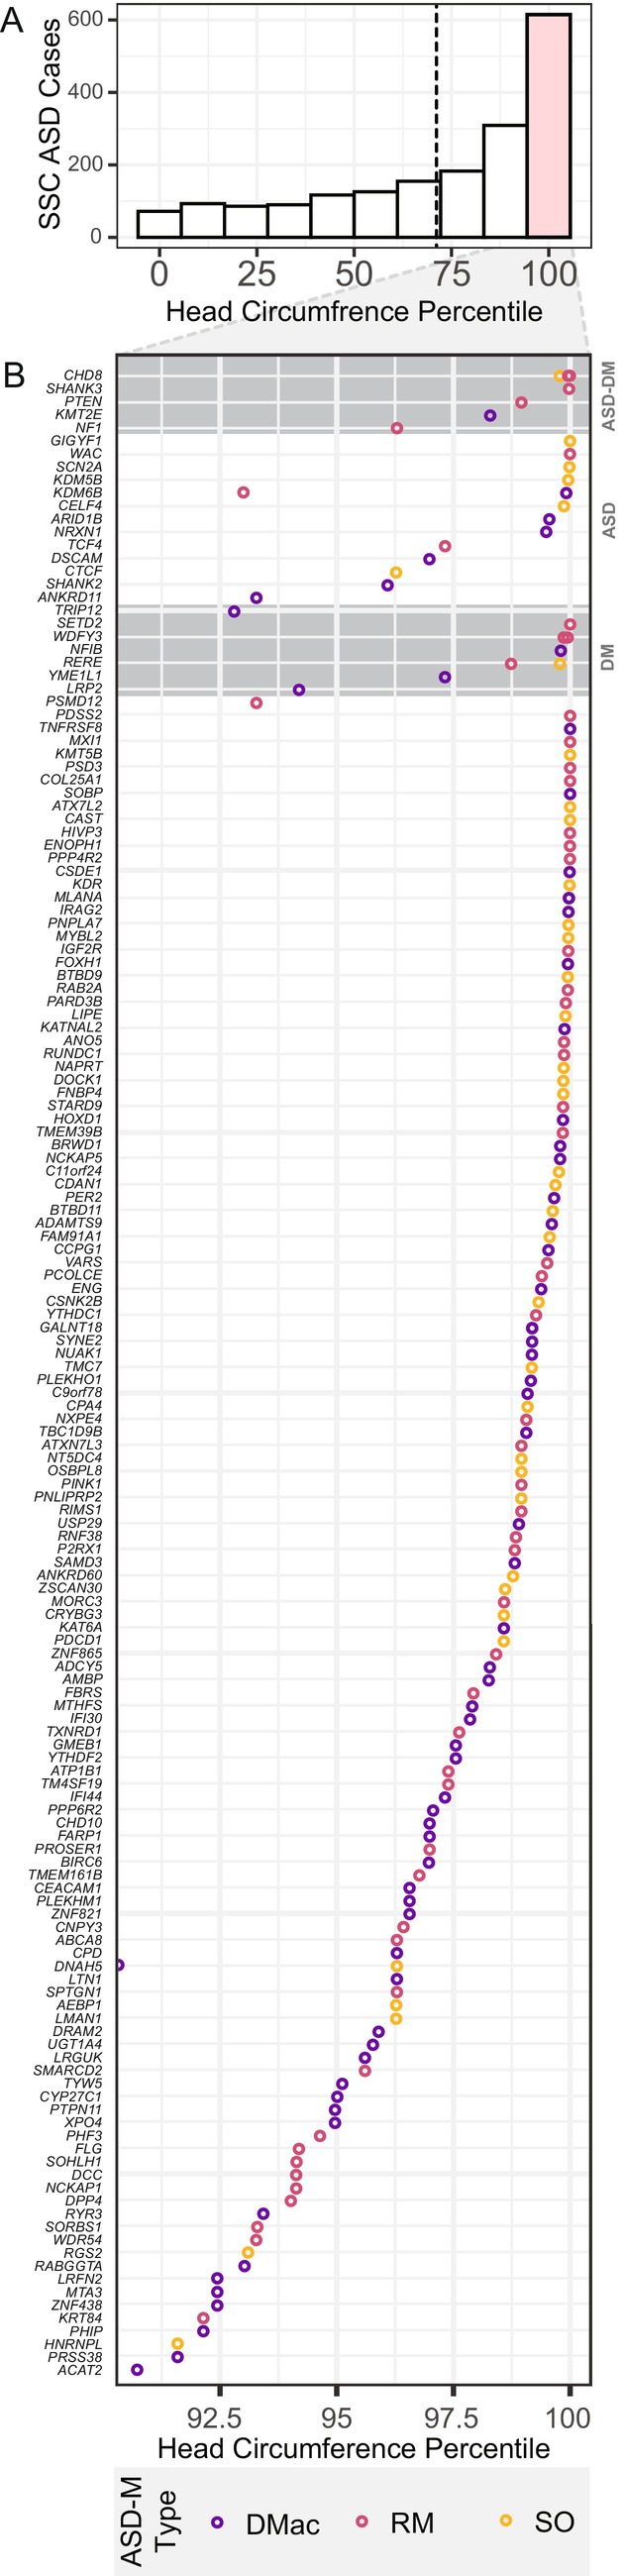
Macrocephaly level of candidate ASD‐DM and ASD‐M genes. (A) A histogram representing the number of SSC probands v. head circumference percentiles shows a skew toward larger head‐sizes compared to age‐ and sex‐matched typically developing children. The red bar designates those meeting the criteria for macrocephaly. The dashed line represents the distribution mean. (B) ASD‐DM and ASD‐M genes listed by their identified proband's head circumference percentiles show genes previously associated with ASD‐DM (first gray quadrant) are more likely to be associated with a higher head circumference percentiles than genes previously associated with autism (second white quadrant) and DM (third gray quadrant) alone. Color represents the macrocephaly type. DMac, disproportionate macrocephaly; RM, relative macrocephaly; SO, somatic overgrowth.