FIGURE SUMMARY
Title

Disrupting USP39 deubiquitinase function impairs the survival and migration of multiple myeloma cells through ZEB1 degradation

Authors
Sirera, J., Sarlak, S., Teisseire, M., Carminati, A., Nicolini, V.J., Savy, C., Brest, P., Juel, T., Bontoux, C., Deckert, M., Ohanna, M., Giuliano, S., Dufies, M., Pages, G., Luciano, F.
Source
Full text @ J. Exp. Clin. Cancer Res.

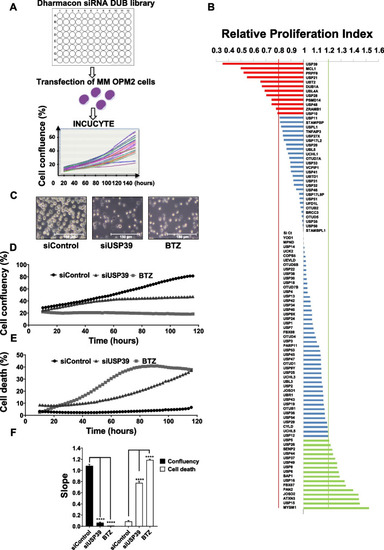
The depletion of USP39 suppresses proliferation and induces cell death in OPM2 myeloma cell line

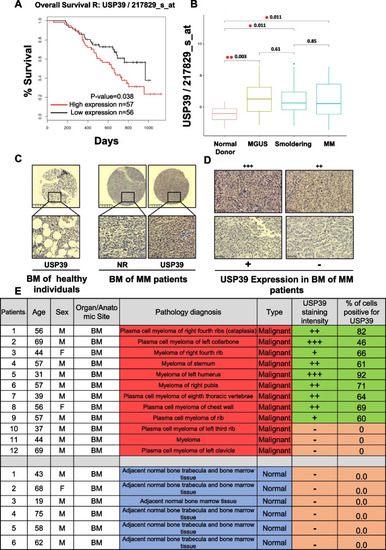
USP39 is overexpressed in MM patients compared to healthy donors and its high expression is correlated with shorter survival. A Kaplan–Meier of overall survival in patients with MM with high (red line) or low (black line) USP39 mRNA expression (P = 0.038) (GEO dataset GSE9782). B USP39 mRNA expression in normal donor, MGUS, Smoldering and MM patients (GEO dataset GSE6477). C Left, Representative USP39 staining of bone marrow samples from healthy individuals. Right, Representative USP39 staining of bone marrow samples from MM patients. “NR” denotes a non-relevant antibody. D Representative USP39 immunostaining of bone marrow samples from MM patients. Staining intensity was interpreted by a pathologist using visual scoring: "– “ undetectable, “ + ” denotes low intensities, “ + + ” denotes medium intensities, and “ + + + ” denotes high intensities. E Table representing USP39 staining of 12 bone marrows from MM patients and 6 bone marrows from healthy individuals. The percentage of USP39 positive cells was determined by ImageJ quantification and confirmed by pathologist visual scoring. Staining intensity were interpreted by pathologist visual scoring: "– “ denotes undetectable, “ + ” denotes low intensities, “ + + ” denotes medium intensities, and “ + + + ” denotes high intensities

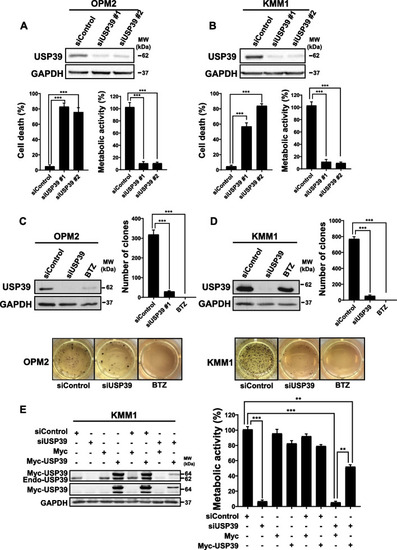
USP39 Depletion Suppresses Cell Proliferation, Induces Apoptosis, and decreases Clonogenicity in OPM2 and KMM1 Multiple Myeloma Cells. A OPM2 cells were transfected with either control or two different single USP39 siRNA (siUSP39 #1 and siUSP39 #2) for 96 h. Then, lysates from these cells were subjected to immunoblots using GAPDH and USP39 antibodies (upper part). In parallel, the percentage of cell death was measured by flow cytometry after IP staining (left lower part) and cell metabolism was assessed by XTT assay (right lower part). B KMM1 were treated as described for OPM2 cells and subjected to the same analysis. C OPM2 cells were transfected with either control or single USP39 siRNAs for 96 h or stimulated with BTZ for 48 h. Lysates from these cells were subjected to immunoblots using GAPDH and USP39 antibodies (upper left). In parallel, the clonogenic capacity of the cells was measured after 10 days within a semi-solid medium. The quantification of the clonogenic assay is reported in the upper right part of the figure. Representative pictures were shown in the lower part. D KMM1 were treated as described for OPM2 cells and subjected to the same analysis. E KMM1 cells were either transfected with Control or USP39 siRNAs for 24 h. Then cells were transfected with Myc-Tag or Myc-USP39 vectors. After 72 h, lysates from these cells were subjected to immunoblots using GAPDH, myc-Tag or USP39 antibodies (left part). After 96 h of transfections, cell metabolism was measured in each condition (right part)

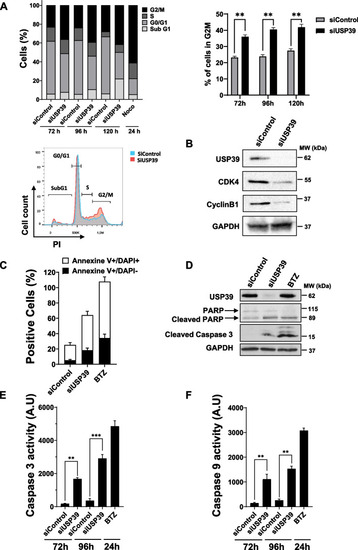
Inhibition of USP39 Triggers G2/M Cell Cycle Arrest and Apoptosis in Multiple Myeloma Cells. OPM2 cells were transfected with control or USP39 siRNAs for 72 h, 96 h or 120 h. In parallel, cells were stimulated with nocodazole (1 µg/ml) for 24 h to block the cells in G2/M phase. Cell cycle distribution was examined by flow cytometry, and percentage of cells in each phase is indicated (top left and right). A representative flow cytometry profile of cells transfected with control (blue area) or USP39 siRNAs (red area) for 96 h (bottom left). B In parallel, OPM2 cells were transfected with either control or single USP39 siRNAs for 72 h. Then, lysates from these cells were subjected to immunoblots using GAPDH, USP39, CDK4 and CyclinB1 antibodies. C OPM2 cells were transfected with either control or single USP39 siRNAs for 96 h or stimulated with BTZ for 48 h. Then, cells were stained by Annexin and PI and analyzed by flow cytometry. % of apoptotic cells (annexin V + /DAPI-) and dead cells (annexin V + /DAPI +) are represented in grey and black respectively. D Lysates from these cells were subjected to immunoblots using USP39, PARP, cleaved caspase 3 and GAPDH antibodies as a loading control. E, F OPM2 cells were transfected with either control or single USP39 siRNAs for 72 h and 96 h, or stimulated with BTZ for 48 h. Then, cells lysates were subjected to caspase 3 (E) and caspase 9 (F) assays

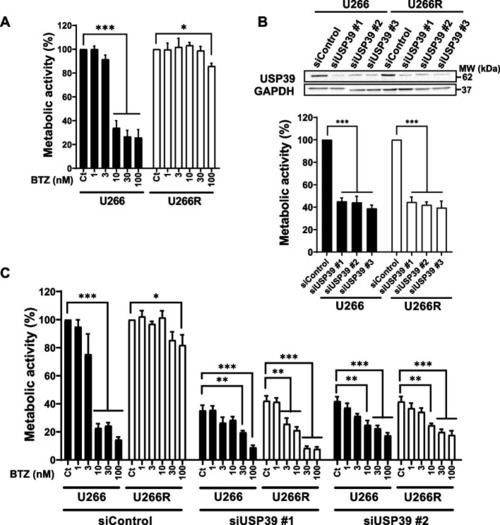
USP39 Inhibition Overcomes Bortezomib Resistance in MM Cells. A U266 cells and its BTZ-resistant counterpart U266R were stimulated with increased concentrations of BTZ (1, 3, 10, 30 and 100 ng/ml) for 24 h, and cell metabolism was measured by XTT assay. B U266 and U266R cells were transfected with either control or three different single USP39 siRNAs (#1, #2 and #3) for 72 h. USP39 silencing was confirmed by immunoblots using USP39 and GAPDH antibodies (top). In parallel, cell metabolism was measured by XTT assay (bottom). CU266 and U266R cells were transfected with either control or two different single USP39 siRNAs (#1 and #2) for 72 h. Then both cells were stimulated with increased concentrations of BTZ (1, 3, 10, 30 and 100 ng/ml) for 24 h and cell metabolism was measured by XTT assay

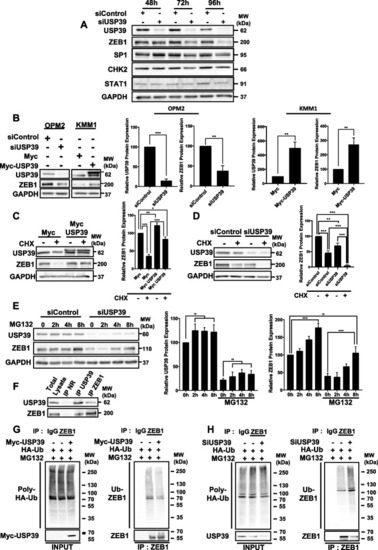
USP39 Stabilizes and Deubiquitinates ZEB1 Protein in Multiple Myeloma Cells. A OPM2 cells were transfected with either control or USP39 siRNAs for 48 h, 72 h or 96 h. Lysates were subjected to immunoblots using USP39, ZEB1, SP1, CHK2, STAT1 and GAPDH antibodies. B USP39 was transiently silenced or overexpressed in OPM2 and KMM1 cells respectively. Then, immunoblots were performed using USP39, ZEB1 and GAPDH antibodies (left) and protein quantifications were determined (right). CKMM1 cells were transfected with plasmids encoding either the Myc-tag or the USP39-Myc-tag proteins. After 48 h, cells were stimulated with cycloheximide (CHX) at 10 µM for 24 h. Lysates were subjected to immunoblots using USP39, ZEB1, and GAPDH antibodies and protein quantification was determined. D KMM1 cells were transfected with either control or USP39 siRNAs. After 72 h, cells were stimulated with cycloheximide (CHX) at 10 µM for 24 h. Lysates were subjected to immunoblots using USP39, ZEB1, and GAPDH antibodies and protein quantification was determined. E OPM2 cells were transfected with either control or USP39 siRNAs for 72 h. Then cells were stimulated for 2 h, 4 h or 8 h with the proteasome inhibitor MG132 at 1 µM. Lysates were subjected to immunoblots using USP39, ZEB1 and GAPDH antibodies. Protein quantification was determined. F Lysates from OPM2 cells were subjected to co-immunoprecipitation experiments using either non relevant (NR), USP39 or ZEB1 antibodies. Immunoblots was performed to visualize complexes using USP39 and ZEB1 antibodies. G KMM1 cells were transfected for 48 h with HA-ub plasmid in the presence or in the absence of Myc-USP39 plasmid. Then cells were treated with MG132 at 1 µM for 8 h and lysates were subjected to immunoprecipitation using non relevant IgG or ZEB1 antibodies. Inputs were immunoblotted with HA and Myc antibodies to visualize poly-HA-Ub and USP39 respectively. IPs products were immunoblotted with HA and ZEB1 antibodies to visualize Ub-ZEB1 complex and immunoprecipitated ZEB1. The graph represents Ub-ZEB1 quantification. H The complementary deubiquitination experiment was performed in presence or absence of USP39 siRNA (72 h)

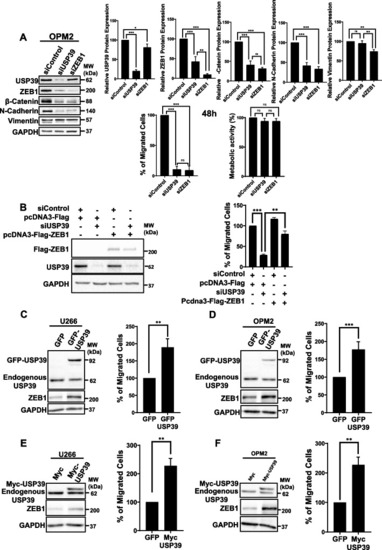
USP39 Promotes In Vitro Transmigration of MM Cells. A OPM2 cells were transfected with control, USP39 or ZEB1 siRNAs for 48 h. Then, immunoblots were performed using USP39, ZEB1, β-Catenin, N-Cadherin, Vimentin and GAPDH antibodies (left) and protein quantifications were determined (right). In parallel, the metabolic activity (lower left) and the migration of the cells (lower right) were measured under the same conditions. B KMM1 cells were either transfected with Control or USP39 siRNAs for 24 h. Then cells were transfected with pcDNA3-Flag or pcDNA3-Flag-USP39 vectors. After 72 h, lysates from these cells were subjected to immunoblots using USP39, Flag-Tag or GAPDH, antibodies (left part). After 96 h of transfections, the migration capacity of cells was measured by Boyden chamber assays (right part). C and D) U266 (C) and OPM2 (D) cells were stably transduced with lentiviral particles encoding GFP or GFP-USP39 and were subjected to immunoblots using USP39, ZEB1 or GAPDH antibodies. E, F U266 (E) and OPM2 (F) cells were stably transfected with lentiviral particles encoding Myc or Myc-USP39 and were subjected to immunoblots using USP39, ZEB1 or GAPDH antibodies. In parallel, the migration capacity of corresponding cells was measured by Boyden chamber assays

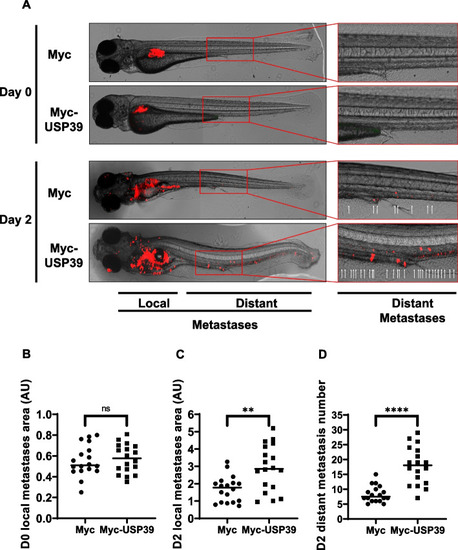
USP39 Enhances Metastasis in Zebrafish: Implications for MM Progression. A-D Zebrafish embryos (N = 36) were injected with U266 cells stably infected with lentiviral particles encoding either Myc-tag or Myc-USP39 proteins (labeled with red DiD) into the perivitelline space. Zebrafish embryos were monitored on Day 0 and Day 2 for tumor metastases using a fluorescent microscope. A (Left) Representative images of local and distant metastases are shown. (Right) Magnification of images representing distant metastases. Arrows indicate metastases. Quantification of the area of local metastases at Day 0 (B) and Day 2 (C) of Myc-tag and Myc-USP39 embryos. Quantification of the number of distant metastases at Day 2 of Myc-tag and Myc-USP39 embryos

Acknowledgments
This image is the copyrighted work of the attributed author or publisher, and ZFIN has permission only to display this image to its users. Additional permissions should be obtained from the applicable author or publisher of the image. Full text @ J. Exp. Clin. Cancer Res.